
Spend Summary Dashboard
What does this dashboard tell me?
The Spend Summary Dashboard provides users with information on open matters based on legal spend by matter type, month, vendors, and main assignee.
Where is it located?
In order to access the Spend Summary Dashboard found on the Reports page, you must have Report Viewing rights.
Learn more about user permissions and security groups on this page.
Can this dashboard be edited and pushed out to other users?
Yes, Report Designers can adjust the filters, which changes the information that is displayed on the widgets, and push it out to other users.
Learn how to edit and share dashboards on this page.
Dashboards and Descriptions
Below, you will find screen shots, descriptions, and breakdowns of the information displayed on the widgets found in the Matter Dashboard.
Interact with the widgets by clicking on any piece of information shown in any of the graphs. This will drill down into that specific piece of information and the rest of the widgets on the screen will reflect the information you selected. Learn more about interactive dashboards on this page.
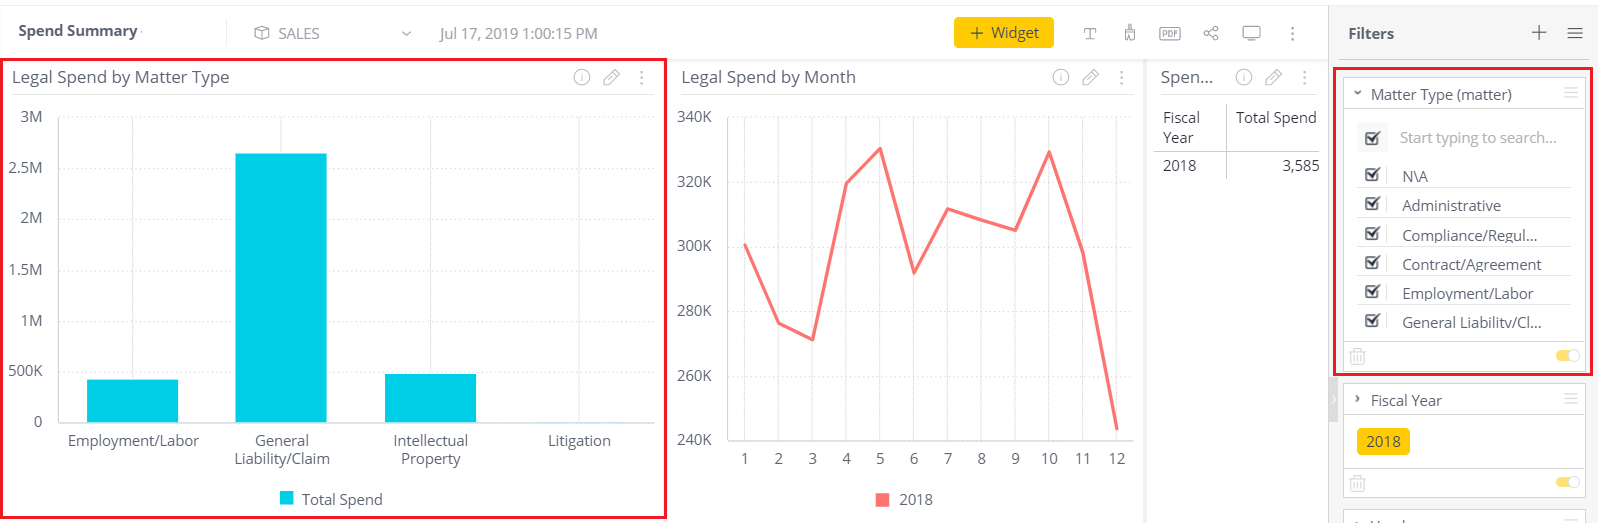
Legal Spend by Matter Type
This widget displays the sum of all posted invoices by the primary matter type.
Edit this widget by adding or removing filters, like Matter Type or Fiscal Year, found in the far right side of the screen.
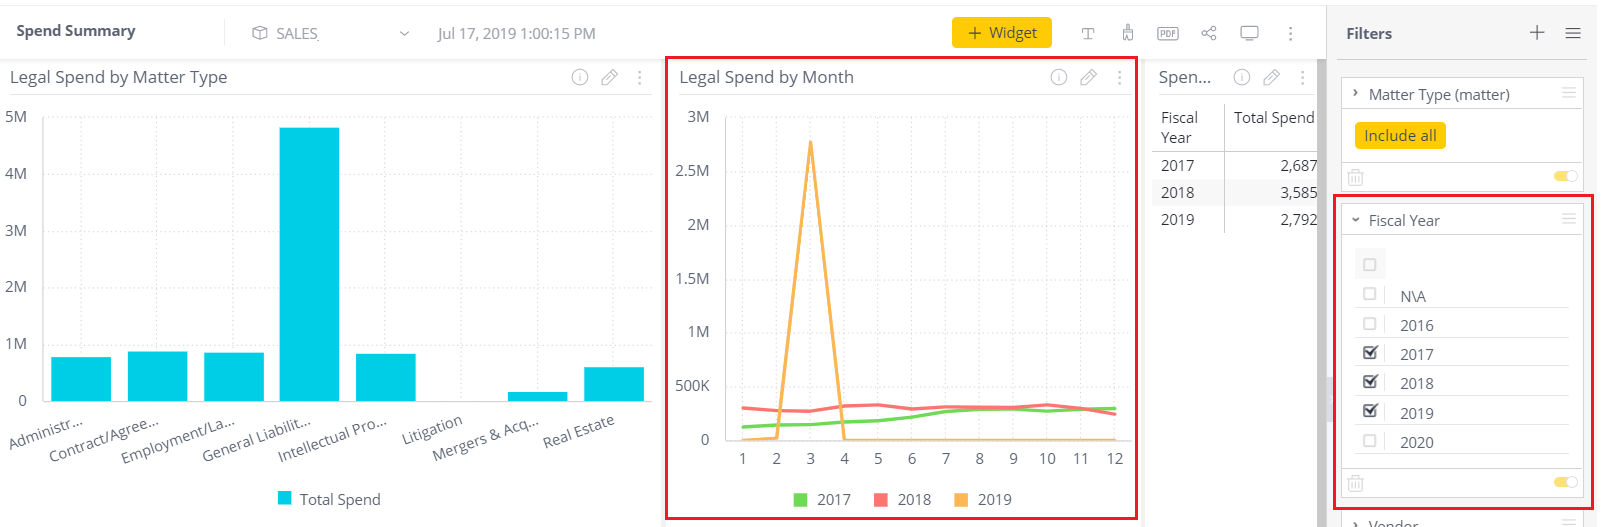
Legal Spend by Month
This widget displays the sum of all posted invoices by month, broken into fiscal years.
The "Month Numbers" on the X-axis (1-12) will reflect the months that your company's fiscal year starts and ends on. For example, if your fiscal year is July-June, then 1 = July on the graph.
Edit the information in this widget by adding or removing filters, like Fiscal Year, found on the far right side of the screen.
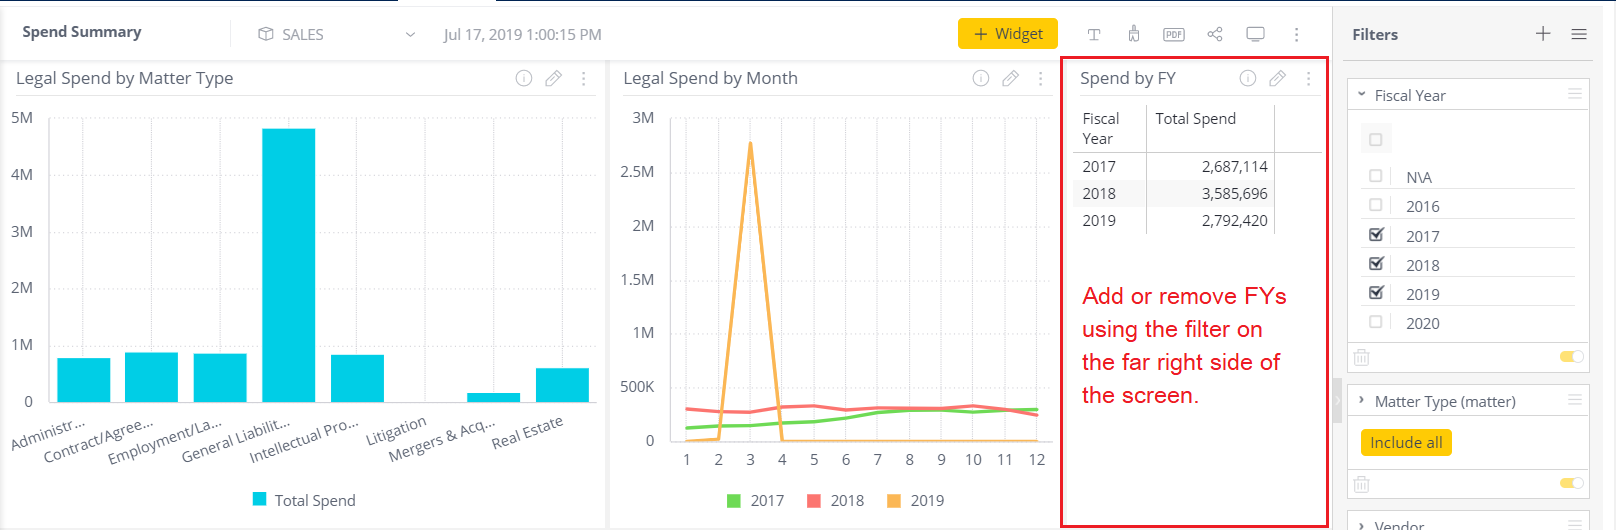
Spend by Fiscal Year (FY)
This widget displays the sum of all posted invoices by fiscal year.
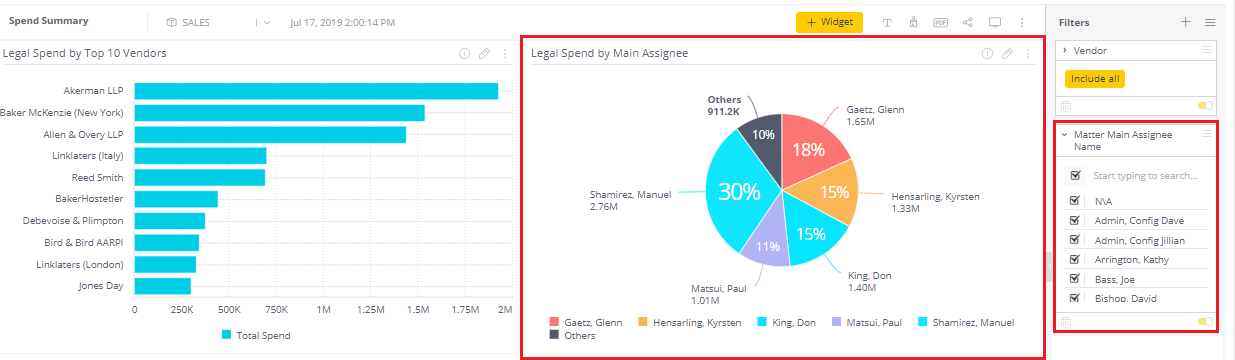
Legal Spend by Top 10 Vendors
This widget displays the sum of all posted invoices for the top 10 firms according to most spend.
Add or remove vendors from this list using the vendor filter on the far right side of the screen.
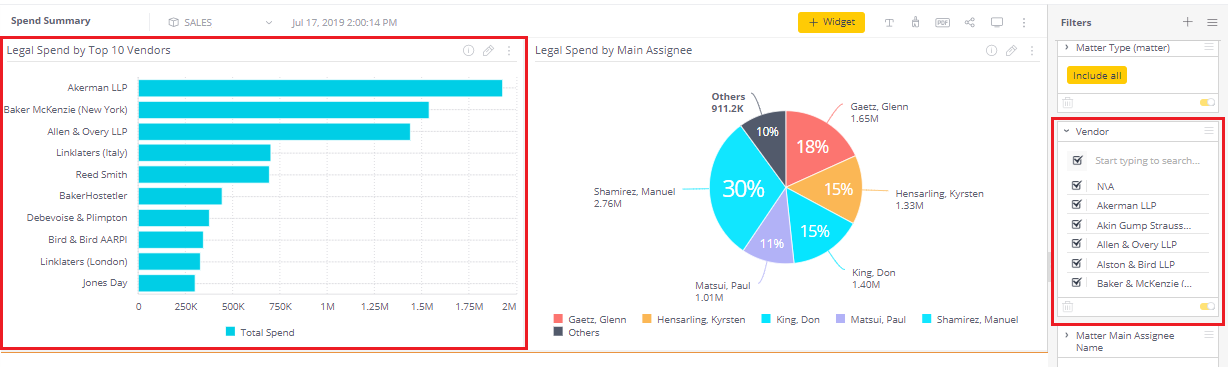
Legal Spend by Main Assignee
This widget displays the sum of all posted invoices according to the primary assignee of the billed matters.
Add or remove main assignees to/from the pie chart using the main assignee filter on the far right side of the screen.
Digging into the nitty gritty
For the Database Administrators who want to know where this information is pulled from in the eCube, the filters for this page are as follows: Matter type, fiscal year, vendor, and main assignee.
IT Personnel and DB administrators can view the eCube Data Dictionary to view the dashboard's data sources.