Editing and Filtering Dashboards
Helpful ways to filter data
The sections below detail the most useful and efficient way to filter and sort data on the Reporting dashboards.
I can't stress this enough:
Always clear your filters - the data shown in the dashboards will be skewed if you filter data, navigate away from the page, then come back and keep filtering.
Select multiple data points at one time
Use Ctrl+Click to select multiple elements to filter on a dashboard.
Master Filters
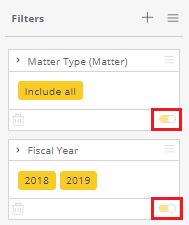
The filters on the far right side of the screen control what data actually appears in the graphics on the dashboard. Turning them on or off (as seen in the section above) will completely remove those data points
Add or Remove entire data points from the dashboard
|
All users can toggle filters on and off. These filters are turned on by default. Simply turn them off if you don't want to use that respective data in their dashboard.
These filters are found on the far right side of the Reporting page. |
|
Date Filtering
Filter information on dashboards by certain dates. This will be important for many Essentials dashboards
Can set filters and then save them as your default filters (Filter hamburger button)
Digging into the granular data
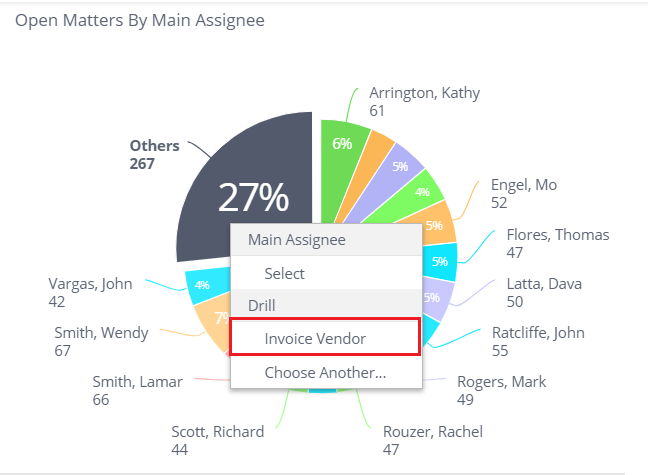
Unless disabled by the dashboard’s Designer, you can drill down into your data in most widgets to get an in-depth view of a selected value. To drill down into an item, right-click the item on the chart, select Drill Into, and select the field into which you want to drill down.
Interactive and Reactive Dashboards
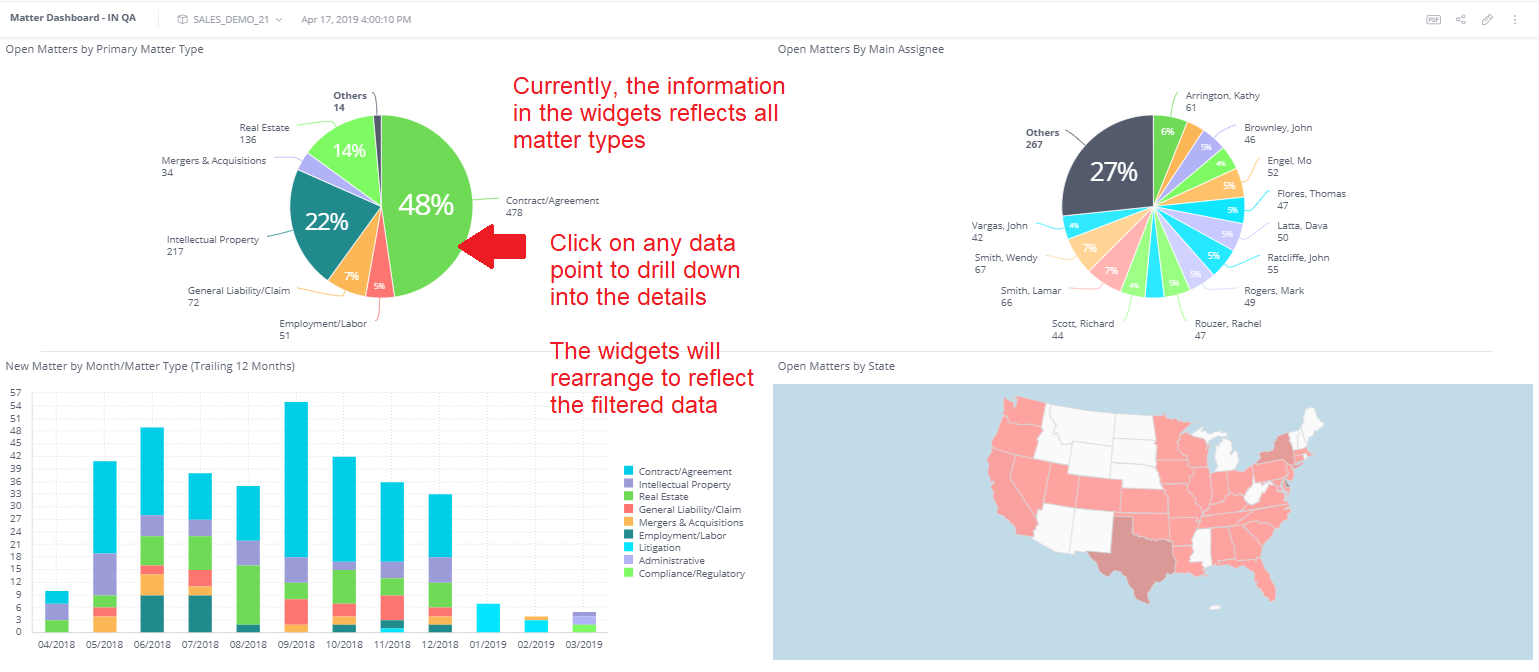
Drill down into the granular data on a single widget by "clicking a piece of the pie". The graphs won't always be pie charts, but you can click on almost any part of a graphic to display details about that particular piece of data.
As you can see in the example below, clicking on the Contract/Agreement area of the pie chart causes the information in the widgets to reflect the new filter.
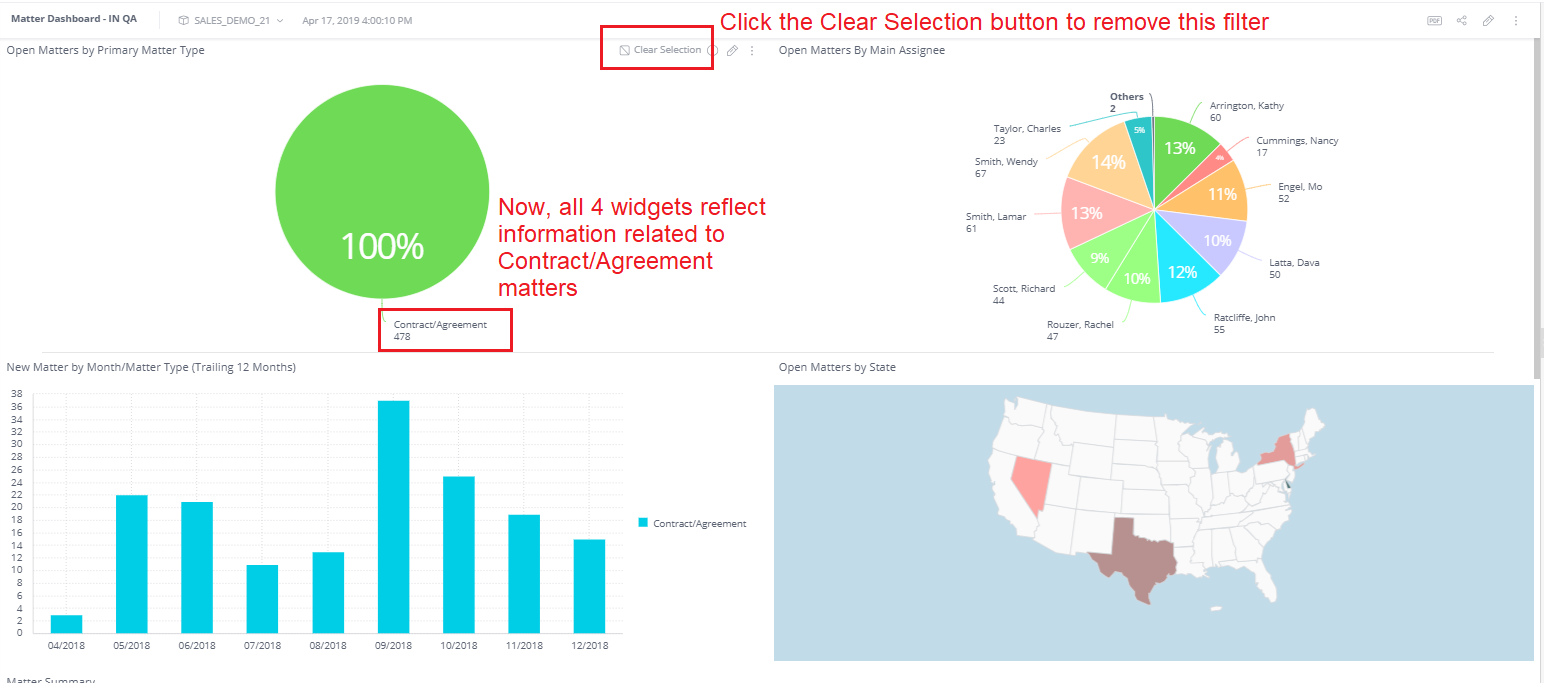
After clicking the Contract/Agreement area:
Using the "Drill Down" option
There is an actual Drill Down option that allows users to access granular data about a certain data point.
Note: The drill down filter will only change the data on the single widget, as opposed to all 4 widgets on the page.
| Right click and select a "drill down" option | The widget (not the whole page) will drill down into the data |
 |
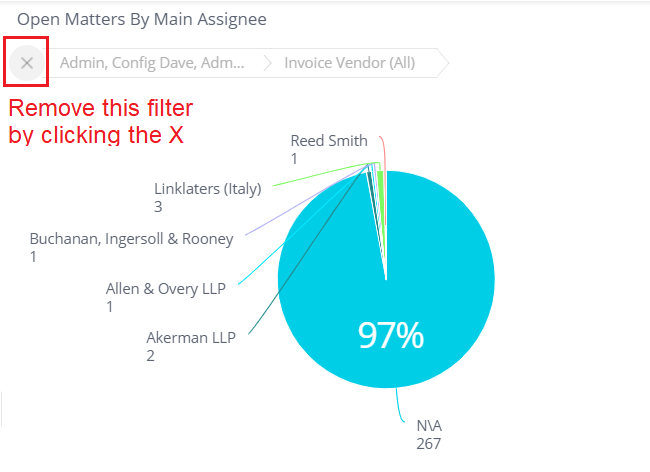 |
Downloading Dashboards
Downloading an entire dashboard means downloading all widgets (typically 4 widgets per page) that are displayed on a respective reporting page. Dashboards can be downloaded into a PDF or image formats.
You can use these static report downloads to capture data from a particular moment in time, and these reports can be shared with people without having to log into TeamConnect. Note that your security permissions are applied to the data downloaded, so if you do not have access to a certain matter type that data will not be reflected in the downloads.
To download a dashboard:
- Click the
 Options icon for the appropriate dashboard and click or hover over the Download option. The Options icon is three vertical dots located in the navigation pane to the right of the dashboard name, or in the upper right corner of an open dashboard.
 - Select Download PDF or Download Image.
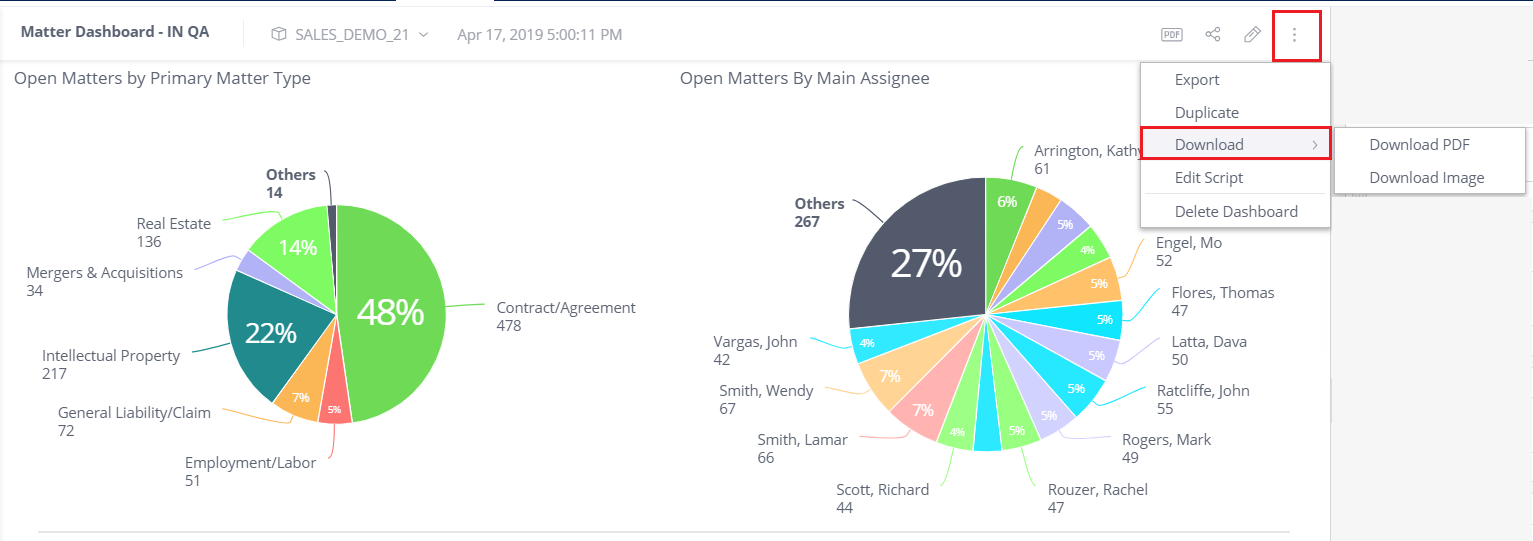
- Select your settings for the PDF or image and click the Download button. The report is converted and downloaded to your computer.
Downloading Widgets
Downloading a widget means downloading the information for 1 of the graphics displayed on a reporting page (for example, download the Legal Spend by Matter Type data rather than all spend data). Depending on the widget, widgets can be downloaded or exported into an image or CSV format.
You can use these static report downloads to capture data from a particular moment in time, and these reports can be shared with people without having to log into TeamConnect. Note that your security permissions are applied to the data downloaded, so if you do not have access to a certain matter type that data will not be reflected in the downloads.
To download a widget:
- Click the Options icon for the appropriate widget and click or hover over the Download option. The Options icon is three vertical dots located in the navigation pane to the right of the dashboard name, or in the upper right corner of an open dashboard.
- Select Image or CSV File. Note that only the displayed (filtered) data is exported according to the currently selected filters.
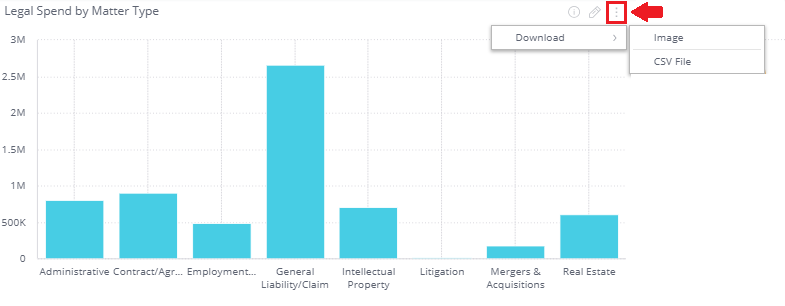
- Select your settings for the file and click the Download button. The widget is converted and downloaded to your computer.
Tip: The image size reflects the size of the widget on the screen when you download it. To create a larger image, we recommend enlarging the widget space in the dashboard or opening the widget in edit view to create a larger image.
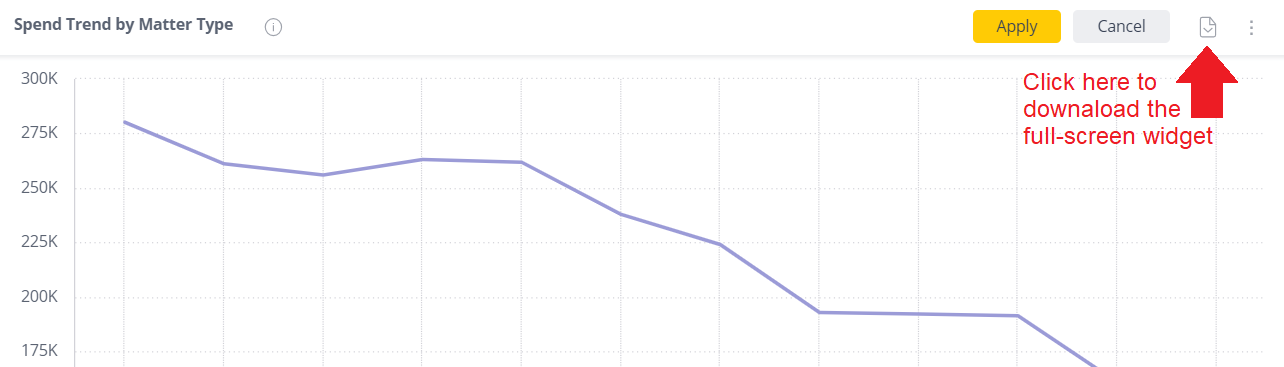
Download full-screen widgets
When you download a widget, the widget size/resolution will appear as it does in the application. To enlarge the widget before you download it:
- Click the edit pencil icon on your widget.
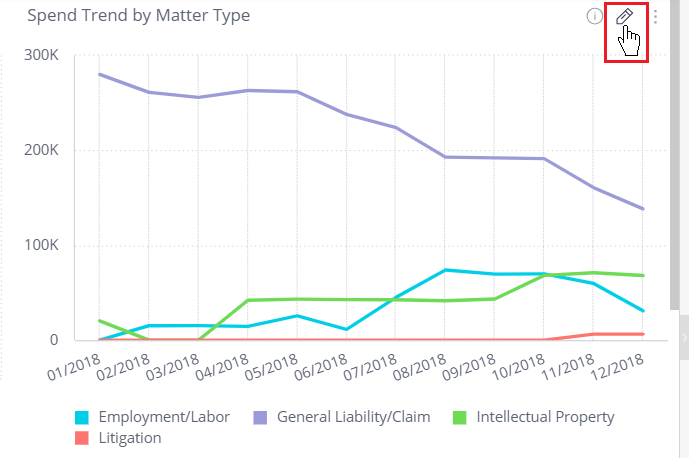
- Click the download icon.