
Building Legacy Reports
Once a report has been built, it is managed and executed as described in Viewing Reports and Running Reports.
To edit an existing report, click the Edit button while viewing the report specification.
To build a new report, click the New button while viewing a listing of existing report specifications. The new report, when completed, will be saved by default in the folder which you had been viewing.
Whether building a new report or editing an existing report, you must edit the report's properties. There are five kinds of property pages. The General Properties, Data Series, and Chart pages have some properties that are mandatory. The report specification cannot be saved until at least those properties have values. Refer to the following topics:
General Properties
The General page allows you to view or edit general properties of a report specification. It appears by default when a new report specification is started, or when an existing report specification is clicked. You can also return to this page by clicking the General tab in the left pane of the report specification page.
The table below contains the general properties of a report specification. Field descriptions are listed in display order.
General Properties Field Descriptions
|
Field |
Description |
|---|---|
|
*Report Name |
Your name for this report specification. Each specification in a report folder must have a unique name within that folder. Maximum length: 250 characters. |
|
Unique Key |
This text string is used for localizing reports - translating the report prompts to other languages. If your organization does not do localization, you should leave this field empty. If you plan to do localization, enter a string that is unique (a string that is not found in the Unique Key of any other reports.) Use only characters A-Z, a-z, and 0-9. Maximum length is 50 characters. This field is only editable if it is empty. Once you have supplied a text value to this field, it cannot be changed. For more information about localization, see Localizing Reports. |
|
Folder Path |
Describes where the report is found in the hierarchy of report folders. This is a read-only link. Clicking the link takes you out of the report edit page to the list page of that folder. |
|
Description |
Text describing the purpose of this report. Optional. Maximum length: 4000 characters. |
When creating a new report, after you save your General values, the Data tab in the left pane is enabled. Click Data to begin creating one or more data series for the report.
Data Series
A data series is a group of data based on filtered criteria and fields you want to appear in the results. A report contains one or more data series. When you have more than one data series, you can combine them if necessary.
The following flowchart illustrates how to create a data series. Click areas of this flowchart for more information. Note: The 'New' Icon has been redesigned for 5.x+ users. This does not affect functionality.

The Data page of the report displays a row for each existing data series, plus a block with parameter information. A parameter is a value for the report that you enter into a prompt when the report runs. When you create a new report, this page is disabled until you specify the properties under the General tab and save. When the report specification is in Edit mode, the Data page allows you to edit and create data series.
You can delete an existing data series or parameter by selecting the check-box next to the row and clicking Remove.
Each row of a data series includes the following fields:
Data Series List Field Descriptions
|
Field |
Description |
|---|---|
|
Order |
A number that controls the sequence of appearance for each data series that appears in the report output. If multiple data series have the same value, they appear in alphabetic sequence of Name. |
|
Name |
The name of the data series in the report output. Click the name to specify data for the data series, as described in Specifying Data for a Data Series. This field is not editable. |
|
Unique Key |
A text string used to localize reports and translate the report prompts and labels. If your organization does not localize, leave this field empty. If you plan to localize, enter a string that is not used as the Unique Key of any other data series in the report. Use only characters A-Z, a-z, and 0-9. The maximum length is 50 characters. This field is only editable if it is empty. Once you enter a text value for this field, you cannot change it. For more information about localization, see Localizing Reports. |
|
Record Type |
The types of records where fields in this data series originate. This field is not editable. |
|
Create a Copy |
Creates a new data series with the same information. After you create a copy, click the text next to the Name field in the Properties section to update it with a better description of the data series. |
Parameter Field Descriptions
|
Field |
Description |
|---|---|
|
Order |
A number that controls the sequence that the report prompts parameters at runtime. If multiple parameters have the same value, they appear in alphabetic sequence of Name. |
|
Name |
The name of the parameter. This name is not visible in the report output at runtime, solution developers may use it to embed the report in a custom page or portal pane. The name also appears in i18n keys for localizing reports. This field is not editable. |
|
Field Type |
The datatype of the parameter. |
|
Operator |
The numeric operator that tests the report data against the parameter value. This field is not editable. |
|
Default Value |
A value that the end user sees at runtime when prompted to enter parameter values. |
Note: You cannot create new parameters using the Parameters block, only while defining filter criteria, as described in Filtering the Data.
Entering New Data Series Information
After you click New, the New Data Series popup appears so that you can enter general information about a data series.
To enter new data series information
- From the New Data Series popup, select a Record Type. The record type determines which types of fields the data series uses to create the report.
- You cannot change the record type after you click Ok.
- Enter a descriptive Name for the data series.
- If you localize TeamConnect, enter a Unique Key.
- (Optional) Enter a number in the Order field. If multiple data series have the same value in Order, they appear in alphabetic sequence of Name in the report output.
- Click Ok to continue.
After you click Ok, you can edit the Name and Order of the data series.
To edit the properties of a data series
- From an open data series, click Edit Properties.

- Under Properties in the left pane, click the text next to Name and Order to edit the current text.

Note: You can also edit Unique Key, in addition to Name and Order, on the Data page of the report. See Data Series List Field Descriptions for more information.
Specifying Data for a Data Series
You specify data for each data series on the Filter Criteria and Results Display tabs. For both tabs, the Fields list in the left pane lists all fields for the chosen record type.

Under the Filter Criteria tab, the Fields list includes all the fields that you can use to filter the data for a report so that only data that meets the filter criteria appears.
Under the Results Display tab, the Fields list includes fields that appear in the results.
Selecting Fields
Drag a field from the Fields list to the work area under the tabs. Make sure a dotted outline appears for the field to stay.
Delete a field by clicking the  icon to the right of its name.
Types of Field Folders
The fields are organized hierarchially within sections.
- System Fields
Standard fields that come with TeamConnect before any customizing is done. -
Custom Fields
Fields the solution developers in your organization add as they customize the TeamConnect design. In some cases, such as Legal Matter Management, custom fields are part of a pre- packaged design that is added to the standard TeamConnect design. Because custom fields are always associated with categories, this section is organized by category. Custom fields from the root category appear first. Expanding a category folder reveals the custom fields that belong to that category. -
Related Fields
Fields that pertain to the record type of the data series but that are not in the actual record type itself. For example, fields from Involved records appear here, as do fields from any child objects or embedded objects that relate to the data series record type. A folder represents each related record type. Expanding that folder reveals the fields that belong to the related record type.
Field Specifics
In each folder, you might have the following types of fields:
-
Folders — A
 icon next to a field indicates additional levels of hierarchy. Click this icon to show additional fields at the next deeper level. For example, fields representing users, such as Created by and Modified by fields, include that icon. Click this icon to reveal the Contact fields associated with the user.
Caution: Using fields from the deepest levels (more than three levels) may cause extensive database access that makes the report run slowly. Use good judgment in such cases, and talk to a solution developer if you have concerns that multi-level fields are causing slow report times.
-
Parent Project — If the record type for this data series is a child or an embedded object, you see a
 icon named Parent Project. Expand the icon to see the fields that pertain to the parent record.
For certain record types, the field has a different name from Parent Project. For example, if the record type is Line Item or Non US Tax, the parent folder is named Line Item Invoice or Invoice (respectively).
-
Object Link (Results Display)—Using this field places a highlighted link with the name of the record in the results display at runtime. When clicked, the link opens the view page for the record. An Object Link is available in the field list of every record type.
-
Formula (Results Display) — A number field you can edit. When you drag a
 Formula field into the work area of the Results Display, you can create a formula.
Filtering the Data
You filter the data by adding filter criteria so that only the data that meets the criteria appears in a report. To specify how data filters, use the Filter Criteria tab.
The visual layout of the Filter Criteria tab resembles a logic diagram, and you may find it helpful to have a logic diagram for your filters sketched out before you begin using this tab.
This tab enables the entry of a large, complex hierarchy of criteria, with mixed AND and OR specifications. You may also enter as few as one criterion if your filter needs are simple, or no filter criteria at all.
To enter filter criteria for a field
- Drag a field from the Fields list to the dotted outline that appears.

- Click the
 icon to the right of the field to edit the Properties of the field.
 - Click the text next to Operator to select from a list of operators.
- If the type of operator selected requires a value, specify a value for the operator in the Value section. You can enter one of the following types of values:
- A literal value — Depending on the field, a list of values or Click to edit text appears. Use the list or text field to enter a value for the operator.
For example, for a date field with the In the Last operator, you could type 10, which would mean that you are filtering on dates that occurred within the most recent 10 days.
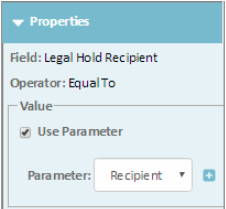
For a date field with the Between operator, if you want a report of all invoices dated after 1/1/2011, enter 1/1/2011 for the first value (the start date), and leave the second value (the end date) empty. - A parameter — Select the Use Parameter check-box to indicate that the report should ask the user for a value at runtime. After checking this box, you may select an existing parameter from the adjacent drop-down list. To create a parameter, see the next section.
- A literal value — Depending on the field, a list of values or Click to edit text appears. Use the list or text field to enter a value for the operator.
To create a parameter
- After you have placed a check-mark in the Use Parameter check-box, click the icon.
- Enter a Name for the parameter. The name is an internal attribute that solution developers use to embed the report in a custom page or portal pane. Use a name that describes the purpose of the parameter. Each parameter name within a report must be unique.
- Enter a Label for the parameter. The label is text that prompts the end user when they run the report.
- (Optional) Enter a Default Value that the user sees when prompted to enter a parameter value.
Note: After you have applied your edits and closed this page, all parameters appear in the Data tab. At that point you can edit their Order property, which determines the order in which parameters appear to the end user at runtime. If you don't change the Order property of parameters, they appear to the end user at runtime in alphabetic sequence of the parameter labels.

To create a parameter for Document record types
If you are reporting on fields related to a Document record, your report might include data for more than one version of the document. To prevent multiple versions from appearing in a report, choose the following values for each field:
- Field — Document Type
- Operator — Is
- Value — Document
Nested Stacks
The Filter Criteria tab includes one or more stacks, which are visual representations of a set of criteria. A nested stack uses the same rules and properties as the previous stack. Each stack includes at least two filter criteria or a field criterion and a nested stack, one level lower in the hierarchy. The following image includes an example of both.

To change a relationship for a stack
The default relationship between filter criteria in a stack is AND. To change the relationship to OR, click the word AND for OR to appear. Click the word OR to change the relationship to AND.

Adding more criteria to an AND stack usually reduces the number of records in the report. Adding more criteria to an OR stack usually increases the number of records in the report.
Note: A very complex hierarchy of filter criteria, particularly nested OR criteria, may create complex database queries that run relatively slowly. If you suspect that your filter criteria may cause slow performance, ask a solution developer for advice about the best way to structure the criteria.
To create a nested stack
Click  in the current stack. A new stack appears, nested one level deeper than the current stack.
To rearrange the hierarchy of stacks
You can move a filter criterion from one stack to another, and move stacks to different parts of the hierarchy. All stacks except the top-level stack display the  icon. Click the icon to drag and drop an entire stack elsewhere in the hierarchy. If the stack has any children, those also move.
To delete a nested stack
Each stack except the top level contains the  icon. Click the icon to receive a confirmation prompt regarding the deletion of the stack. Click OK to delete the stack and any children of the stack in the hierarchy.
Determining the Data that Displays
On the Results Display tab, you choose and arrange the data fields and formulas that appear in the report output.
Note: In the Chart tab, you will have the opportunity to display group statistics (record count, numeric field totals and averages, etc.). Fields used for grouping must also be present in the Results Display.
To enter results display information for a field
- Drag a field from the Fields list to the dotted outline that appears.

- Click the icon to the right of the field to change the Properties of the field.
- (Optional) Click the Click to edit text next to the Label field to determine the heading for the field in the report's output. If you leave the Label property empty, the default label associated with the field appears. All field labels within a data series must be unique.
- (Optional) Click the Click to edit text next to the Unique Key field to enter a string used to localize column headings and translate the label to other languages. If you are using the default label, leave this property empty. If you overrode the default label by entering a value into Label, you should enter a Unique Key so that your overridden label can localize. Enter a string that is not used as the Unique Key of any other result fields in this data series. Use only characters A-Z, a-z, and 0-9. Maximum length is 50 characters.
This property is only editable if it is empty. Once you enter a text value for this field, you cannot change it.
For more information about localization, see Localizing Reports.
-
(Optional) Change the Format of numeric and date fields. The Format of most other fields is not editable.
Numeric fields include the following format options under Properties:
- Decimal Points — Select the number of digits that you would like to appear to the right of the decimal point.
- Total — Select how the summary information for this field calculates the numbers in the column: Sum, Average, or Count.
-
(Optional) Place a check-mark in the Span Columns check-box to make the field appear on a line of its own in the report. When this check-box is not checked, the field occupies a column in the report, with a heading at the top of the column. Span Columns is not available for numeric fields.
In a report, spanned fields appear below the non-spanned fields, and each of their values occupy a full row in the report, spanning all columns. If there are multiple spanned fields, the leftmost spanned field in the Results Display tab appears first, followed by the spanned field to its right, and so forth.
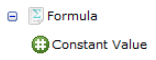
To create formulas
- Drag the Formula field to the dotted outline that appears.
- Next to the Formula field, click the Edit icon. The Edit Formula pane appears below the Results Display work area with the Properties of the formula visible in the left pane.
- Drag at least two fields with a numeric data type to the dotted outlines in the Edit Formula pane.
To enter a constant value for one of the fields, drag the Constant Value field. You may type up to 11 digits to the left of the decimal point and 6 digits to the right.
The formula expression displays as text just above the graphical layout of the operands and operators, and the text updates as you work in the graphical layout and properties pane. -
Choose an operator that indicates how the fields relate to each other. From the drop-down list, choose the plus, minus, multiply, or divide symbol as an operator.
That operator is applied to all the operands found at that level, and the left-to-right order of operations used in algebra is also used in formulas. For example, if a nested level has operands named Budget, Fee, and Expense, and the operator is a minus sign, the portion of the formula expression would be (Budget - Fee) - Expense.
The same principles of nesting that applied to Filter Criteria are used in the Edit Formula work area. Each level of nesting implies a set of parentheses in the final formula expression. See Nested Stacks for more information.
-
Under Properties, enter any additional information as you would for any other numeric field. See To enter results display information for a field for more information.
Combining Multiple Data Series Using Cross-Object Reporting
After you create multiple data series for different objects, you can combine and display the data in a single report using cross-object reporting.
Note: Before you complete the following steps, save the report after you have created all data series.
To combine multiple data series
- Check the Combine Data Series box on the Data page.
- Click the Results Display Configuration button.
- The Configuration page appears.
- Create join conditions. See Join Conditions for more information about the Join Conditions section.
- Add results to display in the report. See Results Display Fields for more information about the Results Display section.
Note: If you later decide that you want multiple, individual data series, unchecking the box Combine Data Series returns your report to individual series.
Join Conditions
After you click the Results Display Configuration button, you can specify the Join Conditions. Each Join Conditions section displays as an area into which you drag fields that connect two data series.
The number of join conditions is equal to the number of individual data series you have defined, minus one. For example, a report with four individual data series requires three join conditions. If a data series is not represented in a join condition, its data does not appear in the report.
Consider the following when you drag fields to the Join Conditions:
- The fields from each data series should be compatible, meaning that both data types match.
- Matching Project fields—A general Project (relating to "All Projects") can match a specific Project (for one record type) or another general Project. However, two specific Project fields must share the same record type, or they do not match.
- Matching Object Link fields—Object Link fields are always specific to one record type, so they can match a general Project or a specific Object Link of the same record type. Two specific Object Link fields of different record types do not match.
- Each join requires you to drag a field from one data series, and then a compatible field from another data series, into the join condition. Fields must be one of the following datatypes:
- An Account
- AUser
- A Contact
- A Project (Custom Object) o An Object Link
Click  in the Join Conditions area to set the type of join from the Properties. The type of join can be an Inner Join or a Left Outer Join. These join types are equivalent to the types of joins found in your database server.
Results Display Fields
Drag output fields from the individual data series in the left pane into the Results Display area. Edit the physical order, formatting, and other properties of those fields in the same way you edit an individual data series. See Specifying Data for a Data Series for more information.
You can drag fields from the Join Conditions into the Results Display area, and (if they are an eligible datatype) from the Results Display into the Join Conditions. The Results Display does not allow the same field, from the same data series, to be dragged in twice.
If you hover the mouse over a field in the Join Conditions area or the Results Display area, popup text shows the name of the field and the data series and path that contains the field.
Sample for Combining Data Series
Combine data series when you want to see data from more than one record type in a single report.
A common use case for combining data series is a report that includes information about all the accounts associated with a project. An example of this report looks like the following figure.
To create the sample report
- Create a report.
- From the Reports tab, click New.
- Enter a Report Name.
- Save the report.
- Click Data in the left pane.
- Create a data series for a project.
- From the Data Series page, click New.
- From the New Data Series window, select a project type for Record Type.
- Enter a Name for the data series.
- Click Ok.
- Select the Results Display tab.
- From the Systems Fields folder, drag the following to the Results Display section:
- ObjectLink
- Matter ID
- Click Apply & Close to save.
- Create another data series for accounts.
- From the Data Series page, click New.
- From the New Data Series window, select Account for Record Type.
- Enter a Name for the data series.
- Click Ok.
- Select the Results Display tab.
- From the Systems Fields folder, drag the following to the Results Display section:
- Project
- Name
- Total Used
- Click Apply & Close to save.
- Save the report.
When you create or update a data series, you must save the report before you use it to create join conditions. - Place a check-mark in the Combine Data Series check-box on the Data page.
- Click the Results Display Configuration button.
- Drag the following Fields to the Join Conditions section:
- Object Link from the project data series folder
- Project from the account data series folder
- Drag all Fields in both folders to the Results Display section.
- Click Apply & Close to save.
- Click Chart in the left pane.
- From the Group By field, select Matter ID.
- Click Save & View from the save drop-down options.
- Click Run Report to see the combined data series in a report, as shown in the sample report.
Best Practices for Combining Data Series
Follow these suggestions to improve the coordination between individual data series and combined data series:
- If you have done edits on individual data series, save your work before you begin work on a combined data series. If you leave work unsaved for individual data series, you will notice the following effects when working on combined data series:
- Newly added, unsaved result fields in existing individual data series are not visible in the left pane.
- Newly added, unsaved individual data series are not visible in the left pane, so they cannot appear in the combined data series report.
- Before you remove a result field from an individual data series, make sure that it is not being used in the combined data series, either as a result field or a join condition field. Otherwise, your attempt to remove the result field from the individual data series will cause an error message.
Chart
Use the Chart page to specify the visual characteristics of the report.
When using graphical charts, it is recommended that you match the type of data to the appropriate type of chart. For example, if you want to show trends over a period of time, it is best to use a line chart instead of a pie chart because a pie chart is designed to display information for a specific moment in time only.
The Chart page presents a Chart Data block for each data series in the report.
Using the Chart Page
Some chart types aren't effective with certain kinds of data series. Be sure to choose an appropriate type. See Types of Report Formats for more information.
Note: If there are a very large number of records that fit the filter criteria, the chart will only show the number of search results that your TeamConnect administrator specified in the search results limit setting. For example, if the administrator specified a limit of 3000 search results, but there are 4400 records that fit your filter criteria, then the chart will be based on only 3000 records.
To create a tabular report
- In the Chart Type section, select Tabular Only.
- Organize the table by groups of data. Use the Order Group By field to select one or more data fields. The options in the Order Group By drop-down lists are the non-numeric options in the Results Display section of each data series.
- Under Order Group By, select the first field from the drop-down list that you want to group data by in the table.
- Click the
 Add icon one or more times to group by another data field within the previous field. You can group by up to five data fields.
 - Click the
 Remove icon to remove an extra data field.
If you are combining multiple data series in a report, you can only group by one data field.
- If you select an option that is Date-related, such as Opened On, the Summarize Date By field appears so that you can specify how to group by the date.
- If you select a category or a lookup table, the Summarize Item by field appears so that you can specify a category or lookup table option.
- To hide detailed rows in the table, remove the check-mark from the Show Details check-box.
By default, the Show Details check-box causes all the fields in the data series to appear in a row after each group of data. If you remove the check-mark, the row of details does not display. - Repeat steps 2 through 5 as necessary for each additional data series.
- Enter a Report Title and Report Subtitle in the Tabular Report Properties section.
- To remove columns for the data fields you are grouping by from the table, remove the check- mark from the Display group-by field as column check-box.
Because each group has a separate summary row at the top of the group, you may not want to display that same value as a column in the report. - Select a save option.
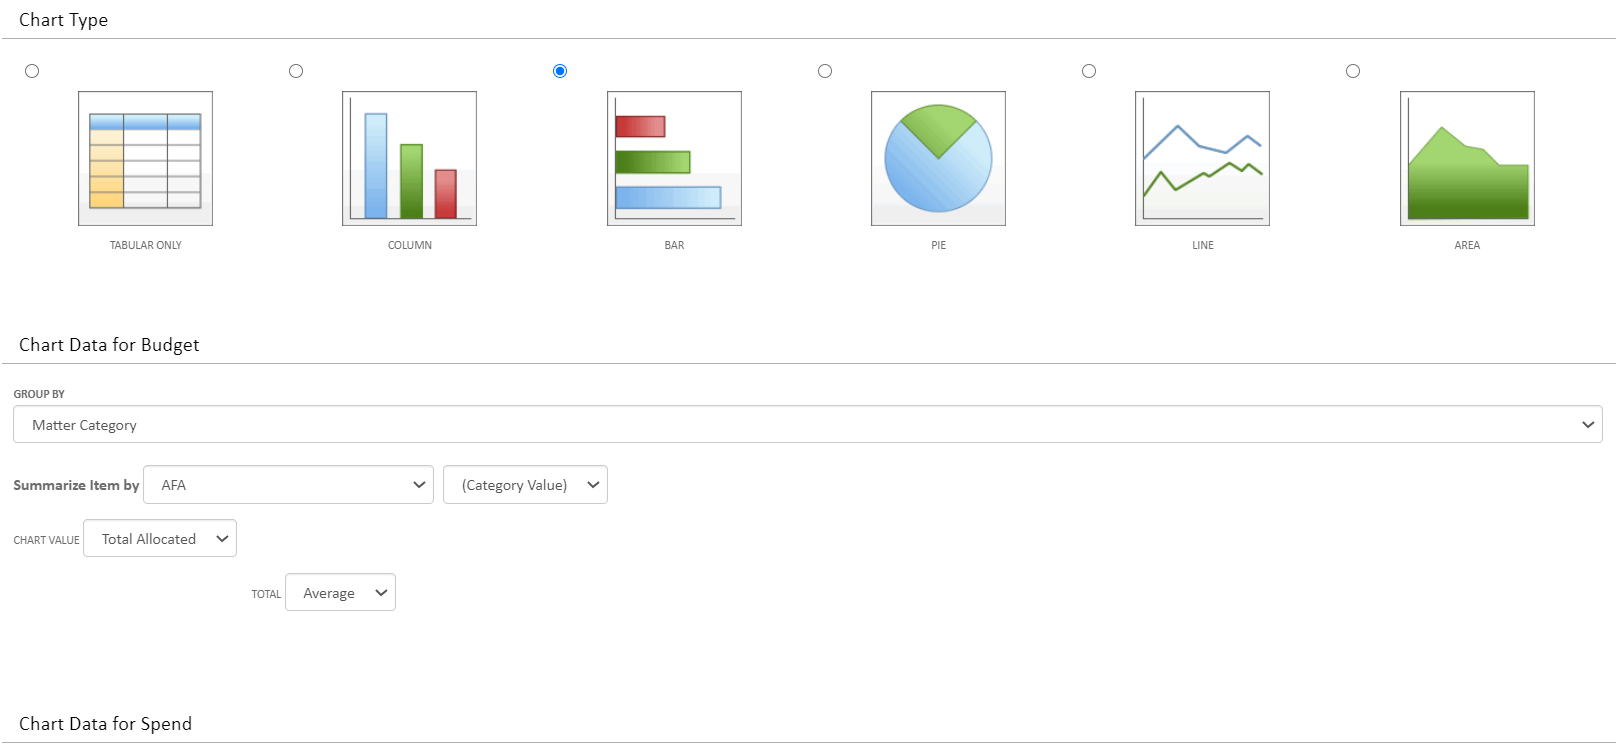
To create a column, bar, pie, line, or area report
- In the Chart Type section, select Column, Bar, Pie, Line, or Area.
- In the Group By drop-down list, choose the field you want to appear as the axis or category on the chart.
All chart types, except pie, contain properties for the x-axis. If a chart has multiple data series that use a date/time field for Group By, choose a date/time field for Group By to ensure a consistent look for the x-axis. The date/time field does not have to be the same field in each data series. Examples of date/time fields are Opened On, Modified On, Closed On, and Inactive Date.
If the Group By field is not a date/time field, the same field type should be used in every data series. - If you select an option that is Date-related, such as Opened On, the Summarize Date By field appears so that you can specify how to group by the date.
- If you select a category or a lookup table for the Group By field, the Summarize Item by field appears so that you can group by a category or lookup table option.
- In the Chart Value drop-down list, choose a field for the value axis. The options in this list are the numeric options on the Data page, Results tab and are used for the value axis. In addition to numeric fields, you may use Record Count to specify a simple count of the number of detail records that make up the Group By.
- Repeat steps 2 through 5 as necessary for each additional data series.
- Use the Chart Properties section to complete the following as necessary for each data series:
If you have chosen a Group By field, the Drill-down field appears. This field is a drop-down list of names of other reports. You can select one of them as a "sub-report". The user who is running the current report can click on an element in the current graphical output (a bar, a pie slice, etc.), and this click action triggers execution of the sub-report that you have chosen. This sub-report uses the clicked-upon Group By as a parameter to limit the sub-report output to just that one category.- A sub-report only appears in the Drill-down list if that sub-report has at least one parameter that is the same datatype as the Group By field.
When your current report is grouping records by date, and it presents data by exact date, then the sub-report must have at least one parameter of the Date datatype. If your current report presents data by month, quarter, or year, then the sub-report must have at least two Date parameters to be eligible to be shown in your choice of reports for drill- down.
- Once you have selected a sub-report in the Drill-down list, the parameters of that sub- report are displayed and you must specify settings for each parameter. If there are multiple parameters, you may choose between settings Use group-by value (when available) or Use default value. At least one of the parameters must be set to Use group-by value.
- A sub-report only appears in the Drill-down list if that sub-report has at least one parameter that is the same datatype as the Group By field.
- (optional) In the Chart Properties section, add or edit the appropriate options. The options that you see in this section depend on the type of chart that you select. See Chart Page, Chart Properties Section for field descriptions.
- In the Data Ranking section, complete the following options if desired. Ranking is based on the first Chart Value selected in the Chart Data section.
- In the Show Results list, select one of the following:
- All: Displays all results in no particular order. This is the default.
- Top: Display results in ascending order.
- Bottom: Display results in descending order.
- If you selected Top or Bottom, in the Maximum Number of Results box, enter a number to define the number of results to display and in what order, such at Top 5 or Bottom 50. You can enter a number greater than 0, and less than 100.
- In the Show Results list, select one of the following:
- Select a save option.
The tables below contain the default fields for the Reports Chart page, Chart Properties section. The fields that you see may vary based on your system settings, assigned rights, and the type of chart that you are using.
Chart Page, Chart Properties Section
|
Field |
Description |
|---|---|
|
Chart Style |
The way that you want the selected chart to appear. The available options are based on the type of chart you selected in the Chart Type section. Options:
|
|
Chart Title |
The name of the chart. |
|
Chart Subtitle |
An additional descriptive name that appears under the Chart Title. |
|
Chart Category Label |
The label name that you want to appear for the selected category. |
|
Chart Value Label |
The label name that you want to appear for the selected chart value. |
|
Legend Position |
Whether or not you want this chart to have a legend, and the placement of the legend. Options:
|
|
Show Labels |
The way that you want the chart labels to appear: Options:
The following options only appear if you are creating a pie chart:
|
|
X-Axis Label Orientation |
The orientation of the X-Axis labels for Bar, Column, Line, and Area charts. Options:
Wrap and Stagger are not supported on the Apple iPad, since Adobe Flash is not available on the iPad. |
|
Minimum Chart Value |
The lowest number that you want to appear as a value in your chart. You can enter negative numbers in this field. |
Chart Page, Group by Options Section
|
Field |
Description |
|---|---|
|
Display group-by field as column |
In a tabular report that is grouped, each group will have a separate summary row at the top of the group. This summary row will display the group-by field value. For this reason, you may find it redundant to display that same value as a column in the report. To display the value in a column, check this box (this is the default.) To suppress that column in the report, uncheck this box. |
The examples below show a Chart page and the resulting chart based on the selected options:
Scheduler
Any existing report can be set up to run on an automatic schedule, with it's output sent to a list of email recipients. Multiple schedules can be set up against the same report, using different recurrence date/time intervals, different parameters, and different email recipients.
Note: To edit the Schedule tab in a report design, you need to have the right of report scheduling assigned to you by your TeamConnect administrator.
Important: When a report is run on demand, its output is localized to match the locale of the user who requested the run. However, when a report is scheduled, the report output will always be produced in the system default locale.
Edit Schedule Information
Each schedule requires information about recurrence, email recipients, and parameters. This information is entered in a similar way for both new and existing schedules. You can gain access to the Schedule tab in these ways:
- Edit a report. Click the Schedule tab.
- From the page that lists reports, click the properties (i) icon for a report. Click the Schedule tab.
To create a new schedule, click the New button.
To edit an existing schedule, click the name of the schedule. On the page that appears, click the Edit button.
To enter basic information about a schedule
- Enter a value for the name of this schedule. Each schedule within a report must have a unique name.
- Choose how frequently the report run recurs. Depending upon the frequency you choose, you must supply additional values (e.g. hours and minutes, day of the month, etc.)
- Specify the start date and time at which this schedule shall become active.
This is not necessarily the date and time that the report will first run. For example, you might create a schedule that runs on the first day of each month, and specify a start date/time of the 20th of the current month. The report will not run on the 20th; instead, it will run on the first day of the next month. Exact information about the next run time is found in column "Next Run Time" when viewing a schedule (see Viewing a Schedule.)
- Choose when this schedule shall end (never, after a specified number of recurrences, or on a specified date.)
To enter information about email recipients
- Choose an address type (To, CC, or BCC).
- Select whether the recipient is an individual user, or a user group.
- Choose the individual or group from the drop-down list.
- Enter a subject for the email (defaults to the name of the report).
- Enter a description, which will become the body of the email. HTML tags are permitted in the description.
- Select whether the recipient should receive an Excel attachment or a .pdf attachment.
- Select whether tabular data should be included with the chart output. For reports whose chart type is "Tabular", this option is pre-selected and not editable.
- If there are more recipients to add, click the "plus" icon at the right edge of the recipient line to create a new recipient line, and follow the steps above.
- You may remove existing recipients by clicking the "minus" icon at the right edge of the recipient line.
Each schedule requires at least one recipient.
Caution: When a scheduled report runs, it uses the rights of the person who created the schedule to determine what information is included in the report. The report output is emailed to recipients who may or may not have rights to that information in TeamConnect. It is beyond the scope of the TeamConnect application to enforce security in the email recipient list. Use prudence when deciding which recipients get which reports.
To enter information about parameters
- Report parameters are displayed, one per line, in this block.
- If no parameters are visible, that means that the report has no parameters defined for it, and you have no need to edit information in this block.
- For each parameter that is visible, choose a value that should be passed to the report when it runs. For a new schedule, the values shown for parameters are the default values that were specified when the report was designed. You may enter different values. You may also clear a value for a parameter, leaving its value empty. The report will ignore an empty parameter (will not use that parameter as a criterion) when it runs.
Viewing a Schedule
Edit a report, then choose the Schedule tab when in edit mode. Existing schedules are displayed, one per line. Click on the name of the schedule you wish to view.
Activating or Deactivating a Schedule
Click on the Activate or Deactivate button at the top of the schedule. When a schedule is deactivated, all information about the schedule is retained, but the report does not run when a recurrence date/time is encountered. When a deactivated report is activated, no action occurs immediately, but the next time a recurrence date/time is encountered, the report runs as scheduled.
Running a Scheduled Report Now
Click on the Run Now button at the top of the schedule. The report runs immediately, using the information specified in the schedule. This immediate run does not affect the schedule of recurring runs.
Note: Run Now is not available if the schedule is currently deactivated.
Deleting a Schedule
Click on the Delete button at the top of the schedule.
Changing an Existing Schedule's Run Time
After a schedule has been created and saved, it calculates its next run time, which is the value displayed in column Next Run Time when you are viewing the Schedule tab of a report. Each time a scheduled report runs, its next run time is recalculated.
If you later edit the schedule and change its frequency and/or its start time, the schedule must recalculate its next run time. It does so based on these rules:
If the schedule's frequency is changed to another value, the schedule refers to its Start date and time, and calculates the next run time which matches the new frequency, and that Start date and time. If that calculated next run time is in the past, the run time is advanced in increments until it is equal to or newer than the present date/time.
If the schedule's frequency is Hours and Minutes, and only the values of the Hours field and Minutes field are changed, the existing value of next run time will remain unchanged. However, when the report runs at that next run time, it will recalculate its run time, and during that recalculation the new values of Hours and Minutes will be used.
Security
This page permits you to explicitly declare which users and groups are allowed, or denied, access to the current report.
By default, access to a specific report is granted to any user who has View rights to the record type upon which a data series is based. You do not need to make changes on the Security page unless you wish to override that default behavior.
This page is used in exactly the same way that Security pages are used for other TeamConnect records. For details on how to use Security pages, see Working with Record Security.
Note: If a report has multiple data series which use different record types, a user must have rights to all of those record types. Otherwise the report is not visible to that user.