
Getting Started
Opening Analysis Center
Analysis Center is accessed through eCounsel or Secretariat.
To Start eCounsel or Secretariat:
- Open a Web browser.
- In the Address text box, enter http://<Server>:<Port>/<Context>/<Product>.htm (where <Server> is the name of the machine hosting Suite, <Port> is the four-digit number over which communication takes place, <Context> is the deployment name, such as Suite8, for Suite, and <Product> is either eCounsel or Secretariat or a name designated by your site).
- Click Go.
- Logon to eCounsel or Secretariat by typing in the login identifier and password, and clicking Login.
To Open Analysis Center:
On the eCounsel or Secretariat console, click on the Analysis Center module.
![]()
The Analysis Center module only appears on the eCounsel or Secretariat console if Analysis Center has been activated for your Suite user account. Contact your system administrator for more information.
The Analysis Center dialog box appears. Note that private reports are displayed on the left side of the dialog box and public reports appear on the right side. Private reports are those reports available for your exclusive use and are only available to the user who created and saved it. Public reports are those reports that are available to you and others users based on security permissions.

To Select a Universe:
Select a universe from which you want to create a report. Universes are custom-built to include information from your company. Click Begin. A new page with a toolbar opens. Click the ![]() New button.
New button.

The Create a document dialog box opens.

Select the Universe data source and then click OK. The Universe selection box opens.

Choose the universe you want to use, and click OK.
Note that the Analysis Center query builder interface uses the BusinessObjects Web Intelligence application OpenDocument interface. Analysis Center integration adds functionality to the BusinessObjects Web Intelligence interface as follows:
- Run reports saved as public in Analysis Center from the Reports module
- Create reports in BI Launch Pad from Analysis Center and publish these reports to the Reports module
- Provide logical grouping for matters and invoices, private matter, and database access security in eCounsel
- Use WorldView security for entities and database access security in Secretariat
See Building Queries with SAP BusinessObjects Web Intelligence Query – HTML and Building Reports with the SAP BusinessObjects Web Intelligence HTML Report Panel documents provided by BusinessObjects for more information on Analysis Center interface.
Understanding the Query Panel
The Query Panel appears when you open Analysis Center, allowing you to begin the query creation process. The main default panes in the panel are Universe outline, Result Objects, Query Filters, and Data Preview.

Universe Outline Pane
The left pane is a hierarchical folder view of the universe and includes objects in the universe. The ![]() folders (classes) can be opened by clicking the
folders (classes) can be opened by clicking the  icon. This reveals access to the following:
- Dimensions – data objects, prefixed with the
 icon.
icon. - Details – data about dimensions, prefixed with the
 icon
icon - Measures – a dimension that contains numeric data intended for calculations, prefixed with the i
 con
con
In general, objects that you want to appear on a physical report can be dragged-and-dropped to the Result Objects pane. You also can double-click an object to move it to the Results Objects pane. However, user- defined objects (UDOs) and formula calculations cannot be moved to the Results Objects pane by dragging- and-dropping. See Adding Custom Variables for more information.
![]() If you double-click a folder’s name, it adds every object that it contains to the Results Objects pane.
If you double-click a folder’s name, it adds every object that it contains to the Results Objects pane.
Each object (dimensions and measures) in the Universe outline pane holds predefined Structured Query Language (SQL) code that writes SQL code in the background, once it is dropped onto the Result Objects pane. After selecting the appropriate objects, clicking the ![]() Run Query button executes the code against the pre- determined source system database. By using this method, users with limited or no knowledge of SQL syntax can write and run SQL statements against a source database. In addition, this method of dragging-and-dropping dimensions and measures ensures that all users are using the same SQL code, regardless of who is running the query.
Run Query button executes the code against the pre- determined source system database. By using this method, users with limited or no knowledge of SQL syntax can write and run SQL statements against a source database. In addition, this method of dragging-and-dropping dimensions and measures ensures that all users are using the same SQL code, regardless of who is running the query.
Universe Layout/Structure
In general, objects in the universe may be organized in a standard folder/subfolder arrangement common to Microsoft Windows Explorer. In BusinessObjects, these folders are referred to as classes. At the highest level, these folders correspond to the eCounsel or Secretariat modules, such as one folder for matters and one for entities.
For each class, subclasses correspond to the various eCounsel and Secretariat tabs available for that record type. For example, the Matters folder contains the available Matters module tabs.
Finally, each tab-specific folder contains the actual objects containing the data for each data element available on the tab in eCounsel or Secretariat. When you create queries and reports in the universe, simply select the object from a hierarchy that should already be familiar based on experience with eCounsel or Secretariat.
Standard Universes
A standard eCounsel or Secretariat universe contains only the standard fields with the default names. This universe is the basis for the creation of a custom universe.
Custom Universes
Based on your eCounsel or Secretariat design, certain data elements may be hidden or relabeled. Changes may be made globally that affect all matters in eCounsel or entities in Secretariat, regardless of type. You also can configure custom universes to only affect certain matter and entity-types. Additionally, the on-demand tabs and fields feature allows new fields to be defined by a system administrator and added to existing tabs in eCounsel or Secretariat; or new tabs may be defined and configured with custom fields. Again, these custom user fields may appear globally or be specific to a given matter or entity type.
The challenge, when implementing changes to the universe, is to reflect your organization’s unique design and still maintain usability and functionality. To meet both goals, Mitratech has developed the following custom universe design.
First, any global changes are identified in the implementation of eCounsel or Secretariat.
- For label changes, the existing global object’s label is changed.
- For custom user fields, these fields are added to appropriate module/tab.
Second, any matter-type or entity-type specific changes are identified in the design data.
- For label changes, the existing global object is copied and the label is changed to “(Matter/Entity Type) New Name”. For example, if the Matter Name field has been relabeled “Case Name” for litigation matters, a new object named “(Litigation) Case Name” is created.
- For custom user fields, these fields are added to the appropriate module/tab with the matter/entity name appended to the beginning of the object’s name (in this case, the object is named with the user field’s description value). For example, a custom field named “Verdict” added to the litigation matter type becomes “(Litigation) Verdict”.
The end result is that all custom objects are grouped together by the matter/entity type in the class that corresponds to the module/tab on which the field appears. In this way, any user can quickly identify and locate any custom field in a single place in the layout of the universe.
![]() Important Note: Objects that are specific to a particular matter/entity type do not filter based on that matter/entity type. In the example above, if a new object named “(Litigation) Case Name” is created, it will behave exactly like the default Matter Name object. If the user selects this object, it will contain data for all matter types unless the user actively filters the universe results based on the matter type. If a user selects a
Important Note: Objects that are specific to a particular matter/entity type do not filter based on that matter/entity type. In the example above, if a new object named “(Litigation) Case Name” is created, it will behave exactly like the default Matter Name object. If the user selects this object, it will contain data for all matter types unless the user actively filters the universe results based on the matter type. If a user selects a
custom user field specific to a certain matter type, only those matters with data in this field have results in this field.
Finally, in order to facilitate the need for users to potentially filter queries/reports based on matter or entity type, the customization process includes the creation of a number of pre-built filter options, or conditions, based on the matter/entity types present in the client’s configuration.
The conditions may be added easily to any query in the Analysis Center window via drag-and-drop.
Query Panel Components
The Query Panel contains the following options:
![]() Data Outline pane – (enabled by default) shows or hides the Universe outline folder-tree structure.
Data Outline pane – (enabled by default) shows or hides the Universe outline folder-tree structure.
![]() Filters pane – (enabled by default) shows or hides the Query Filter pane.
Filters pane – (enabled by default) shows or hides the Query Filter pane.
![]() Data Preview pane – (enabled by default) shows or hides the Data Preview pane.
Data Preview pane – (enabled by default) shows or hides the Data Preview pane.
![]() Scope of Analysis pane – shows or hides the Scope of Analysis pane.
Scope of Analysis pane – shows or hides the Scope of Analysis pane.
![]() Add a combined Query – combines multiple queries together; the combination summary appears on the bottom of the Data Outline panel.
Add a combined Query – combines multiple queries together; the combination summary appears on the bottom of the Data Outline panel.
![]() Query Properties – opens a report configuration dialog box.
Query Properties – opens a report configuration dialog box.
![]() View Query Script – shows details on the query script based on how you define the report components; also allows you to edit the script by choosing the User custom query script option.
View Query Script – shows details on the query script based on how you define the report components; also allows you to edit the script by choosing the User custom query script option.
![]() Add Query – allows you to add a query to the report from another universe, Microsoft Excel spreadsheet, BEx document, or from the Analysis View pane (any available data).
Add Query – allows you to add a query to the report from another universe, Microsoft Excel spreadsheet, BEx document, or from the Analysis View pane (any available data).
![]() Data Outline pane views – change the pane display from the default Master Perspective folder-tree view, to the navigation path, which reflects the database structure.
Data Outline pane views – change the pane display from the default Master Perspective folder-tree view, to the navigation path, which reflects the database structure.
![]() The Show List button – (located at bottom right of Query Panel) allows you to toggle between multiple queries. The arrow buttons become functional when there are more query (tabs) than there is space in the Query Panel.
The Show List button – (located at bottom right of Query Panel) allows you to toggle between multiple queries. The arrow buttons become functional when there are more query (tabs) than there is space in the Query Panel.
![]() The Search field – (located at the top of the left folder list) allows you to search for an object. Search results begin to display as you type, which is useful if you do not know where a particular object is located.
The Search field – (located at the top of the left folder list) allows you to search for an object. Search results begin to display as you type, which is useful if you do not know where a particular object is located.
Result Objects Pane
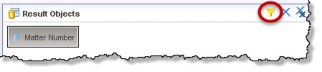
Once you add objects to the Results Objects pane, the objects can be dragged-and-dropped to the Query Filters pane in order for a filter to be applied to a query data provider. You also can highlight the object in the Results Objects pane and click the ![]() Add Quick Filter button.
Add Quick Filter button.
Query Filters Pane
Once an object appears in the Query Filters pane, you can specify the criteria that will be used to filter the data provider results. You can select from a list of values or a user-defined prompt when you run a query.
Creating a Query
Creating reports using Analysis Center is as easy as dragging-and-dropping the desired data elements onto the
Result Objects pane in the Query Panel.
To Create a Query:
- Open Analysis Center.
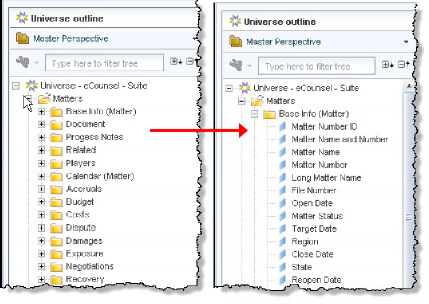
- In the Universe outline pane on the Query Panel, expand the Matters folder and then expand the Base Info (Matter) folder.
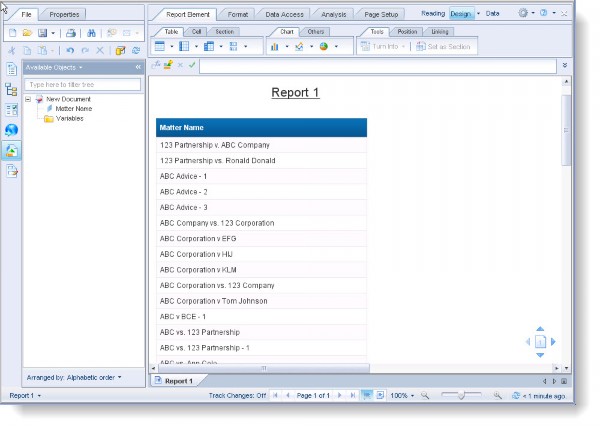
- Drag-and-drop the Matter Name object to the Results Objects pane:

![]() Tips:
Tips:
- You also can double-click on an object to move it to the Result Objects pane.
- To delete an object, highlight it and press the <Delete> key on your keyboard.
- Add the Matter Number, Matter Type, and Open Date objects to the Result Objects pane.
Running a Query
You only need to add a single result object to the query to be able to run the query.
To Run a Query:
Click the ![]() Run Query button to execute the query.
Run Query button to execute the query.

![]() After clicking the
After clicking the ![]() Run Query button, a message box may appear indicating the query is running. This message box will remain on the screen for several seconds to several minutes depending on the complexity of the query and the number of rows being retrieved from the database. Since time estimates are based on how long prior queries took to run, the first query will not have a time estimate.
Run Query button, a message box may appear indicating the query is running. This message box will remain on the screen for several seconds to several minutes depending on the complexity of the query and the number of rows being retrieved from the database. Since time estimates are based on how long prior queries took to run, the first query will not have a time estimate.
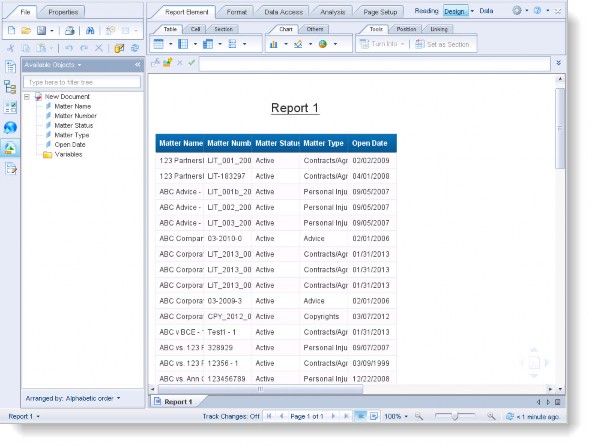
After you run the query, the report data appears in the Edit Report panel.
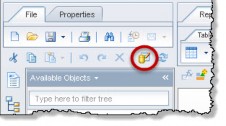
To return to the Query Panel, click the ![]() Edit Query button located on the top left toolbar.
Edit Query button located on the top left toolbar.
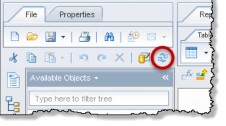
To refresh the query from within the Edit Report panel, click the ![]() Refresh button located next to the Edit Query button.
Refresh button located next to the Edit Query button.
![]() Tips:
Tips:
- If you are editing the query, you must have the Query Panel open.
- If you are editing the appearance of the report, you must have the Edit Report panel open.
Adding Filters to a Query
When building reports, users typically need to filter data based on a certain value in the data. For example, when you generate a report listing, the only matters generated are ones you selected. You may need to filter this data further to make your analysis more efficient. It is possible to either build the parameter into the report itself – called a “filter” – or to provide information used to filter the data – called a “prompt”.
To Add a Filter:
- Using the “Running a Query” steps above, expand the Matters folder and then Base Info (Matter). Add Matter Name, Matter Number, Matter Type, Open Date, and Matter Status.

- Drag-and-drop the Matter Status object to the Query Filters pane. You also can highlight it and click the Add a quick filter button
 .
.

- On the List of Values dialog box, select Active from the list of values, click the
 right arrow button.
 - Click OK.
Alternatively, you can type the value directly into the text box and then click the Find button. The drop- down menu allows you to specify “Match case” so that you can narrow your search using case-sensitivity. When you are done adding filter values, click OK.

- The query filter appears in the Query Filters pane of the Query Panel. If you need to modify it, choose from one of the following drop-down menu options.

Constant – Allows you to manually enter a value(s)
Value(s) from list – Opens the List of Values dialog box which allows you to add or remove additional values
Prompt – Allows you to manually enter a value(s) that you can further configure by clicking the ![]() Prompt Properties button .
Prompt Properties button .

Prompt Properties allow you to specify the following:
- Prompt text – editable filter name that appears when you run or refresh the report
- Prompt with list of values – (checked by default) displays a list of available values that you can add to the filter
- Select only from the list – limits the filter query to what is available to help prevent typing a value that does not exist in the current database (this is only available when Prompt with list of values is selected)
- Keep last values selected – (checked by default) leaves the filter configured with the prior value; this can be changed as needed
- Optional prompt – When selected, this setting will run the report whether or not you specify additional filter values (i.e., makes the Query Filter optional)
- Set default values – Sets a default value that displays when a report is run for the first time (or refreshed)

Object from this query – opens a window that allows you to choose an object or variable from the database
- You can further modify the query filter by selecting an option from the list of operators.

![]() Tips:
Tips:
- To specify a single value, select Equal to.
- To specify multiple values, select In List.
- Click the
 Run Query button.
 - The report will now show only those matters where the status is “Active.”
To Add a Prompt Filter Type:
If you need to run multiple reports each with a different filter, you can use “prompt” filtering which will prompt you for filter values every time you run a report. To add a prompt filter to a report, do the following.
- Setup the report parameters and query filter using the steps in the prior Adding Filters to a Query section.
- Add an additional Result Object to the Query Filters pane, such as Matter type.
- Select the appropriate operator from the middle drop-down list. In this example, specify multiple values for the type by choosing In List from the list of operators.
- Click the far right drop-down menu and choose Prompt.

- Click the
 Run Query button.
 - The Prompts dialog box appears allowing you to specify one or more values (in this case, Matter Type values) from the list of values.

- Type a value manually and then click the
 right arrow button, or chose one of the available values and either use the
  right arrow button, or double-click the value to move it to the Selected Value(s) field. Then click OK to run the report with the selected filter values.
The report will display only those active matters matching the values specified by the user.
Adding Objects to a Query
Using the simple report created in the previous section, now you will add additional objects to the report. To do this, you need to use the Query Panel.
To Add Additional Objects to an Existing Query:
- If you are in the Report Panel, click the
 Edit Query button.
 - In the Query Panel, locate the object(s) you want to add. For this example, select the Open Date dimension from Base info (Matter) and move it to the Result Objects pane.
- Click the
 Run Query button.
 - Note that the report results are not updated with the additional Law Area information. Add the new object to the report by dragging it from the Available Objects pane to the edge of the existing table until you see a small rectangle appear.

Placement of the object is very important. Notice that when dragging the object to the table, elements of the table are highlighted as the mouse pointer passes over them.
- To append a new object to the table, position the mouse so the rectangle highlight appears at the edge of the existing column where the new data should be placed.
- To replace the contents of a cell in the report, position the mouse so that the entire cell is highlighted. The new data now appears on the report.
Scheduling an Analysis Center Report
To schedule an Analysis Center report:
- In Analysis Center, click Open BI Launch Pad.
- Click the Documents tab.
- In the navigation pane, click the Folders tab at the bottom of the pane and locate the folder containing the saved reports. Note that Analysis Center reports may reside in a nested directory structure following these conventions:
- The root folder (as defined by the Root BO Directory value in the Suite Manager BusinessObjects system settings)
- A subfolder of the root folder from above matching the unique database identifier (as defined by the Database Identifier value on the Database Properties Administrator page for Bridgeway Suite)
- A subfolder of the previous folder named “Analysis Center”
- A subfolder of the Analysis Center folder matching either the user’s Bridgeway Suite login name (for private reports) or “Shared” (for public reports)
- A subfolder of the previous folder matching the Bridgeway application (either “eCounsel” or “Secretariat”)
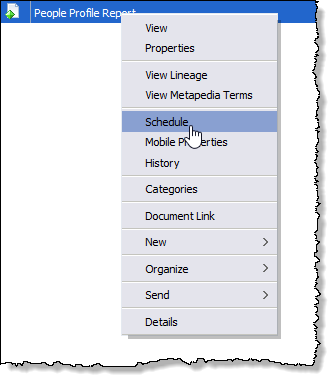
- Right-click the report in the main pane and select Schedule.
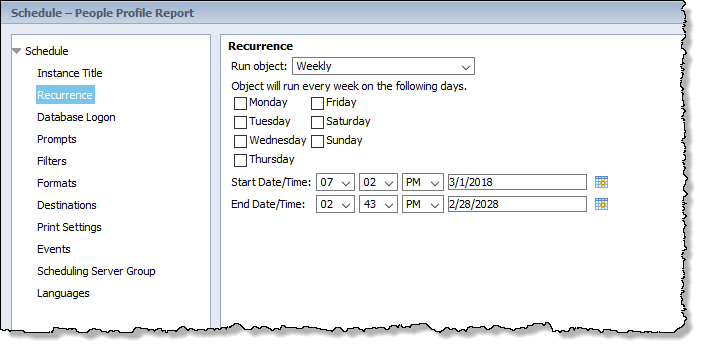
- Click Recurrence on the Schedule pane and select how often to run the report from the Run object menu. Options will vary depending on your select.
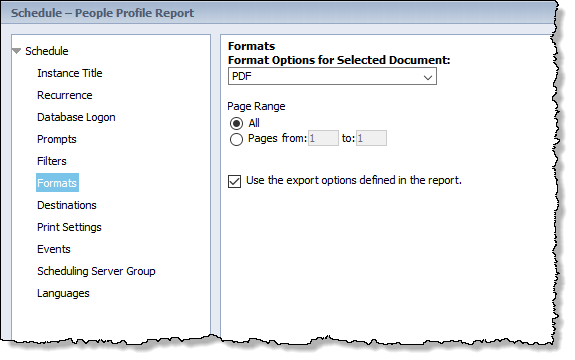
- Click Formats on the Schedule pane and select the format for the report from the dropdown menu and configure the options.
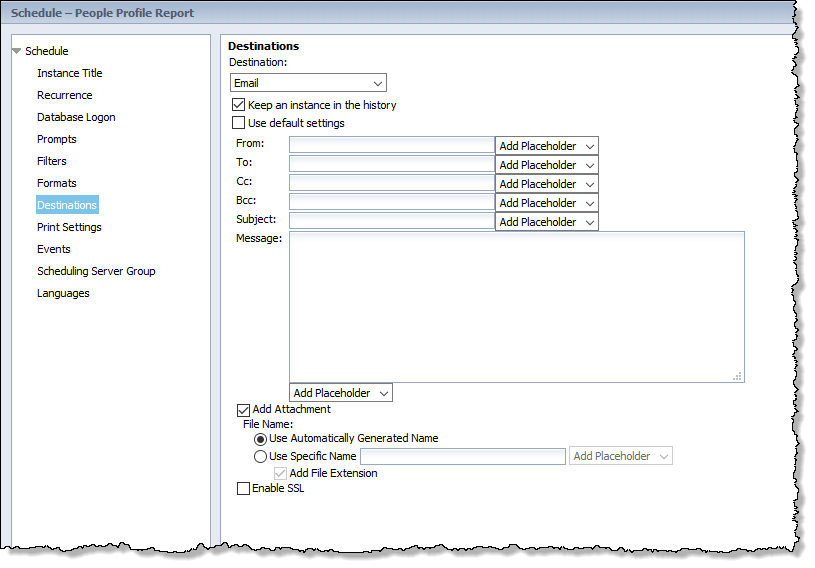
- Click Destination on the Schedule pane and select the method of delivery for the report and configure the options.
- Click the Schedule button. The report now appears in the list of scheduled reports.