
Working with Reports
Understanding the Edit Report Panel
When you design a query in the Query Panel and click the ![]() Run Query button, the Edit Report panel appears. Like the Query Panel, the Edit Report panel consists of three main components: the toolbar, the Edit pane, and the Report pane.
Run Query button, the Edit Report panel appears. Like the Query Panel, the Edit Report panel consists of three main components: the toolbar, the Edit pane, and the Report pane.

Toolbar
The toolbar contains buttons for the more commonly used report-editing functions and is organized with the following tabs.
![]()
Some of the items available on the toolbar also are available by right-clicking in the Report pane. The critical functions available on the toolbar are:
![]() Document – (Properties tab) Contains functions for editing and saving documents.
Document – (Properties tab) Contains functions for editing and saving documents.
![]() Find – (File tab) Searches the contents of a report.
Find – (File tab) Searches the contents of a report.
![]() Undo – Undoes the last change made to the report (same as the Microsoft Windows <CTRL> + <Z> function). This button is useful when modifying reports.
Undo – Undoes the last change made to the report (same as the Microsoft Windows <CTRL> + <Z> function). This button is useful when modifying reports.
![]() Page Navigation – Navigates the contents of a report.
Page Navigation – Navigates the contents of a report.
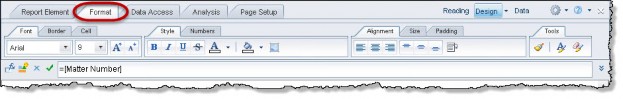
The formula field is located just above the report contents.
![]()
If the formula field is not visible, right-click in the toolbar and select Formula Bar. The formula field contains buttons that reflect the contents of cells:
![]() Create a Variable – Allows the creation of custom variables. Custom variables are described in Adding Custom Variables.
Create a Variable – Allows the creation of custom variables. Custom variables are described in Adding Custom Variables.
![]() Formula Editor – Opens the Formula Editor dialog box to modify the contents of a cell(s).
Formula Editor – Opens the Formula Editor dialog box to modify the contents of a cell(s).
![]() Validate Formula – Checks the formula in the selected cell for syntax or other logic errors.
Validate Formula – Checks the formula in the selected cell for syntax or other logic errors.
![]() Cancel Formula – Cancels the effects of the formula in the selected cell.
Cancel Formula – Cancels the effects of the formula in the selected cell.
![]() Modify Formula – Displays the contents of the selected field. Typically, this text box shows the name of the selected object or variable. For column headers or text boxes, the field shows the text contents. For these types of objects, the field may be edited directly to add or modify the contents of these objects.
Modify Formula – Displays the contents of the selected field. Typically, this text box shows the name of the selected object or variable. For column headers or text boxes, the field shows the text contents. For these types of objects, the field may be edited directly to add or modify the contents of these objects.
Edit Pane
The Edit pane contains a number of views with useful report information. To change the view in the Edit pane, select the desired view by clicking the buttons at the bottom of the pane.
Views include the following:
![]() Document Summary – Contains document creation information (mainly who and when).
Document Summary – Contains document creation information (mainly who and when).
![]() Report Map – Contains report information in the document.
Report Map – Contains report information in the document.
![]() Input Controls – Manages the input controls in the current document.
Input Controls – Manages the input controls in the current document.
![]() Web Service Publisher – Publishes content to a URL
Web Service Publisher – Publishes content to a URL
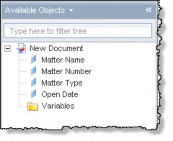
![]() Available Objects (default view) – Contains all of the available report objects selected from the Query Panel.
Available Objects (default view) – Contains all of the available report objects selected from the Query Panel.
![]() Document Structure and Filters – Displays the document structure and filters.
Document Structure and Filters – Displays the document structure and filters.
![]() Chart and Table Types – Contains drag-and-drop elements that can be added to the report, such as a new table or chart, plus special cells such as those used for page numbering.
Chart and Table Types – Contains drag-and-drop elements that can be added to the report, such as a new table or chart, plus special cells such as those used for page numbering.
All Edit pane views can also be accessed from the top menu.

Report Pane
The Report pane contains the data from the report. The bulk of the editing of the finished report, including report formatting, occurs in this pane.

Formatting Reports
You may need to change the appearance of the report to better organize the data to make it more readable or to match company standards.
Formatting a Column
Data in columns can be modified for a number of reasons. For example, you may want to format a date so that the year is not shown or add a dollar sign ($) to a column containing U.S. currency values. All formatting options are available by right-clicking a cell in a column on the Edit Report panel and selecting the Format Cell submenu.
![]() Even though the menu says Format Cell, changes made in this dialog box affect the entire column, not just an individual cell.
Even though the menu says Format Cell, changes made in this dialog box affect the entire column, not just an individual cell.
You can also access formatting options at the top Format tab.
General
To access the Format Cell dialog box, right-click a cell and choose Format Cell.
The General tab on the Format Cell dialog box contains options for sizing the column. Typically, it is easier to resize using the functionality in the Report pane to resize a column by clicking and dragging the edge of the column to the desired width. However, to specify a fixed width or height for a column, it may be entered on this tab.
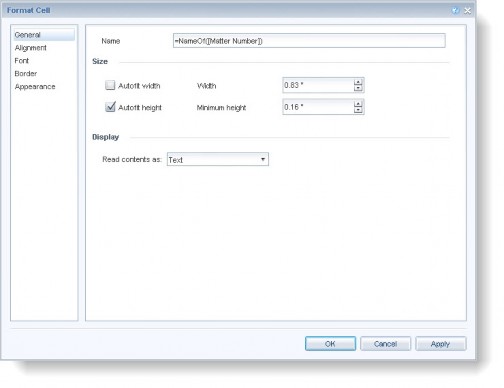
For dynamic sizing, select the Autofit checkboxes. When checked, the Autofit checkboxes allow you to specify minimum width and height.
Alignment
The Alignment tab on the Format Cell dialog box contains options for aligning the data within the cell. Alignment refers to the data’s position within the cell. The default horizontal alignment for text is left align, whereas numeric data is right-aligned.
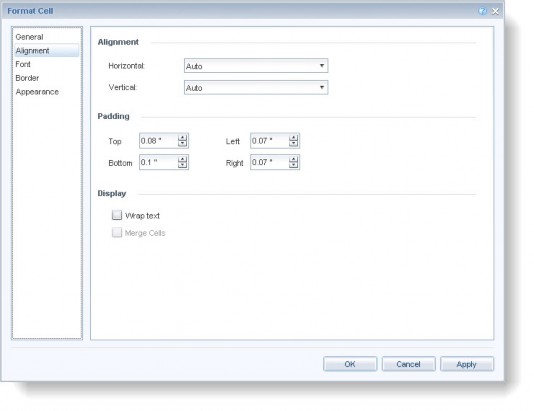
- The Alignment area controls the horizontal and vertical alignment of the data in the cells. To change the alignment of the column, click the drop-down menu and choose the appropriate option: Left, Center, or Right horizontal alignment or Top, Center, or Bottom vertical alignment.
- The Padding area allows you to change the default padding, or empty space, surrounding a column’s data. It is possible to increase this value without changing the size, which can force the data in the cell to exceed the column’s size, cutting off the data. Therefore, use caution when changing this value.
- The Wrap text checkbox will wrap text within the cells.
- The Merge Cells checkbox allows multiple cells to be merged into a single cell. Note that merging cells does not merge the data in those cells.
Font
The Font tab on the Format Cell dialog box contains options for modifying the font used for the column.

- The Font area contains a specific list of available fonts (fonts that are installed on the local machine).
- The Font Style area allows the modifications to the font’s weight (Regular or Bold) and style (Italic).
- The Font Size area allows you to increase or decrease the font’s size.
- The Color area allows you to change the color of the font.
- The Underline Effect allows you to underline text.
- The Strikethrough Effect allows you to strikethrough text.
- The Preview pane shows how the text will appear in the cell.
Border
The Border tab on the Format Cell dialog box allows you to draw borders in the selected column.

Configure the border style with the Style drop-down menu and the border thickness with the Thickness drop- down menu. Adjust the border color with the Color drop-down menu. Define which sides of the cell you want these settings to apply to by selecting the corresponding border button.
![]() Top border
Top border
![]() Bottom border
Bottom border
![]() Left border
Left border
![]() Right border
Right border
![]() All borders
All borders
![]() No borders (clears selection)
No borders (clears selection)
The Preview pane shows how the text will appear in the cell.
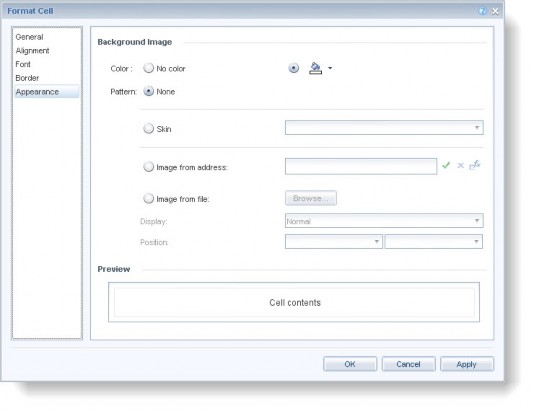
Appearance
The Appearance tab on the Format Cell dialog box allows you to specify the background color and pattern for the column, including the ability to add an image in the background.
Number
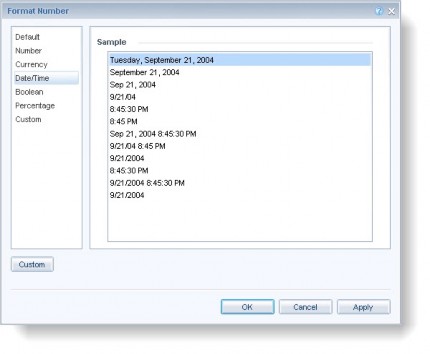
For cells containing numeric data (including dates), the format of the data in the column can be modified in the Format Number dialog box which is access by right-clicking a selected column containing data in numeric format. The Format Number dialog box contains a list of various options that control comma placement, decimal precision, and currency symbols. For data in date format, the Date/Time tab contains a list of options for dates that control the order of the various date components, the numeric or text format of those components, and whether or not to display the time.
Formatting a Table
The General, Appearance, and Layout options for formatting tables differ from the formatting cell option (the Border option is the same in both table and cell formatting options).
To access the Format Table dialog box, hover over the top of the table until you get the multi-select arrow ![]() , and then right-click and choose the Format Table option at the bottom of the context menu.
, and then right-click and choose the Format Table option at the bottom of the context menu.

General
The General tab on the Format Table dialog box controls both the name of the table and the behavior of the table with respect to the default elements of the table itself.

- The Name field is used to give the table a name that describes the contents of the table (useful when a report contains data in multiple tables).
- The Display area controls the behavior of the default elements of the table.
- The Avoid duplicate row aggregation checkbox, when checked, causes duplicate rows to appear individually. Since this checkbox is unchecked by default, the default table behavior is to aggregate duplicate rows.
- The Show table headers checkbox, when checked, causes the header row to appear. This option is checked by default.
- The Show rows with all empty measure values checkbox, when checked, causes rows to appear in the table even when some (or all) of the rows contain no data. This option is checked by default.
- The Show table footers checkbox, when checked, causes the footer row to appear. This option is unchecked by default.
- The Show rows for which all measure values = 0 checkbox, when checked, causes rows to appear in the table even if a row’s measure value is 0. This option is checked by default.
- The Show rows for which the sum of measure values = 0 checkbox, when checked, causes rows to appear in the table even if that row’s measure sum value is 0. This option is checked by default.
- The Show rows with empty dimension values checkbox, when checked, causes rows to appear in the table even if they do not have a dimension value. This option is checked by default.
- The Hide always checkbox, when checked, hides the table entirely, regardless of the data and/or other options. This option is unchecked by default.
- The Hide when Empty checkbox, when checked, causes the table to appear even when there is no data in the table. This option is unchecked by default.
- The Hide when following formula is true: checkbox, when checked, hides the table when it contains a formula you specify and validate. This option is unchecked by default.
Border
The Border tab on the Format Table dialog box allows you to draw borders in the selected table.

Configure the border style with the Style drop-down menu and the border thickness with the Thickness drop- down menu. Adjust the border color with the Color drop-down menu. Define which sides of the cell you want these settings to apply to by selecting the corresponding border button:
![]() Top border
Top border
![]() Bottom border
Bottom border
![]() Left border
Left border
![]() Right border
Right border
![]() All borders
All borders
![]() No borders (clears selection)
No borders (clears selection)
The Preview pane shows how the text will appear in the cell.
Appearance
The Appearance tab on the Format Table dialog box allows you to specify the background color, pattern, or image for the column. It also allows you to specify table spacing, padding, and an alternate color.
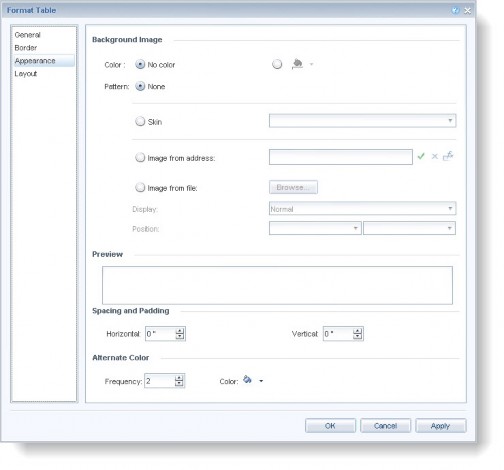
The Alternate Color feature allows you to alternate the color for any non-header cell. The Frequency sets how often the alternate color is used. For instance, if you specify an alternate color and leave this frequency at the default setting of 2, then every other row displays in the color you specified.
For additional alternate colors, click More Colors from the dropdown menu next to the icon.
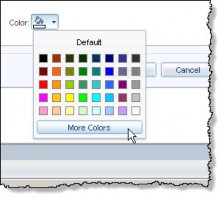
A new dialogue box appears with options for Swatches, HSV, HSL, RGB, and CMYK colors.
Layout
The Layout tab on the Format Table dialog box controls both the table’s behavior on page breaks and position relative to other elements of the report.
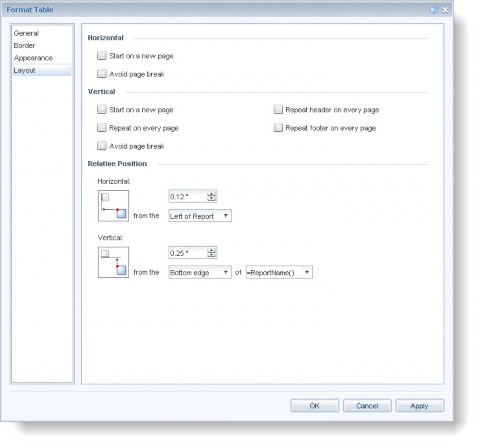
- The Horizontal area configures the horizontal placement for report elements (tables, etc.). Data that is sectioned with the horizontal options can be configured to break on a page to the right of the page from which it is segmented. To configure horizontal placement, choose from the following:
- The Start on a new page option groups table data together and creates a page break as needed to keep the related data together.
- The Avoid page break option forces the table to a new page if the table exceeds the current page.
- The Vertical area configures the vertical placement for report elements (tables, etc.). Data that is sectioned with the vertical options can be configured to break on a page below the page from which it is segmented. To configure vertical placement, choose from the following:
- The Start on a new page option groups table data together and creates a page break as needed to keep related data together.
- The Repeat header on every page option causes the report header to repeat at the top of each page, if the table spans multiple pages.
- The Repeat footer on every page checkbox causes the table footer information to repeat at the bottom of each page, if the table spans multiple pages.
- The Repeat on every page checkbox causes the table’s first row (the dimensions, etc.) to repeat at the top of the table on every page.
- The Avoid page break option forces the table to a new page if the table exceeds the current page.
- The Relative Position settings control the placement of the table on the page relative to other report objects. By default, a table is placed relative to the edges of the report. It is possible to either change the default distance from the report objects or position the table based on other report objects, such as other tables using the Horizontal and Vertical selections.
- To change the relative horizontal placement of the table, specify a distance in the numeric field and then choose the alignment of the relative position (Left of Report, Left edge, or Right edge).

- To change the relative vertical placement of the table, specify a distance in the numeric field and then choose the alignment of the relative position (Top of Report, Top Edge, or Bottom edge) and from which report component (in the of dropdown menu).

- To change the relative horizontal placement of the table, specify a distance in the numeric field and then choose the alignment of the relative position (Left of Report, Left edge, or Right edge).
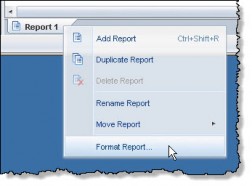
Formatting a Report
The Format Report dialog box contains basic information about the report name and the report header and footer sections. Changes can be made to the layout of the report. To access the Format Report dialog box, right-click the report tab at the bottom of the report and choose Format Report.
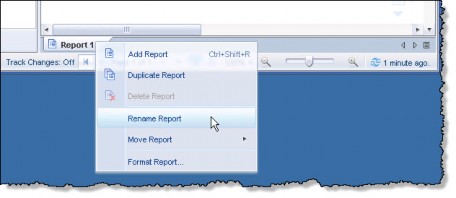
![]() By default the title at the top of the page is configured with =ReportName() so that it will display the name of the report tab. If you want to name the report title something other than the default, either double-click the report tab (named “Report1” by default), or right-click it and select Rename Report.
By default the title at the top of the page is configured with =ReportName() so that it will display the name of the report tab. If you want to name the report title something other than the default, either double-click the report tab (named “Report1” by default), or right-click it and select Rename Report.
General
The Name field in the General tab contains the report name (not to be confused with the report title). Analysis Center supports the ability to create a single report with multiple tabs, each containing a separate report based on the same data provider. Naming the report gives the tabular report a unique name that is displayed on the report tab, making navigating the reports more intuitive.

Border
The Page content (Quick Display Mode Only) allows you to configure how many records will display on each page both vertically and horizontally. The Border configuration functions the same as the cell and table format options.

Appearance
The Appearance section also functions the same as the cell and table format options, but provides one additional option that allows you to change the hyperlink colors (visited and unvisited).

Layout
The Layout tab allows you to specify the page size, orientation, scaling, margins, header and footer. By default both the header and footer are active.

![]() Notes:
Notes:
- When printing, note that the default print size is A4. Unless you use A4, you will need to change the page size to Letter or Legal before printing.
- The Margins area contains the margin sizing information.
Sorting Data on a Report
When a report is initially created, the data is sorted by the first column in the report results table. While this default behavior is usually desirable, it is sometimes necessary to sort data by another column on the report.
To Sort Report Data:
On the Edit Report panel, right-click anywhere within the desired column, select the Sort submenu, and select the appropriate sort type value from the submenu.

The available sort options are:
- Ascending – lowest to highest
- Descending – highest to lowest
- Advanced… – user-defined order
Once you have sorted a report, you select Remove All Sorts to return to the default sort order.
Note also that the Edit Report panel supports multi-level sorting, so that data can be sorted by multiple columns in the report results. To use multi-level sorting, simply apply the sorting on columns in the order you would like the sorts to occur.
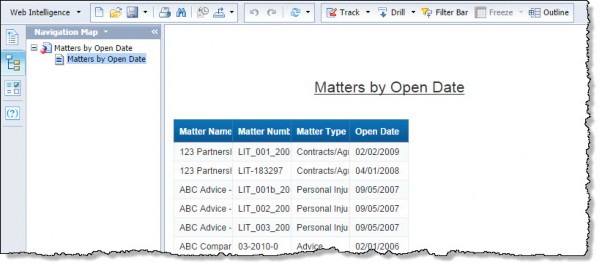
For example, generate a matter list with the Matter Name, Matter Type, and Open Date. In order to sort the matters first by Matter Type and then by the Open Date, right-click on the primary sort column (Matter Type) and select Sort – Ascending. Then, right-click on the secondary sort column (Open Date) and select Sort – Ascending. Note that setting the secondary sort does not remove the initial sort; instead, the secondary sort is applied after the primary sort, so that the matters are grouped (sorted) by matter type then, within the Matter Type group, listed by open date.

Removing Data from a Report
Often data needs to be moved to another location on the report or removed altogether. Relocating a column of data is as simple as removing the column from the report then re-adding it in the appropriate location.
To Remove a Column from a Report:
Right-click on the appropriate column, select the Delete submenu, and from the Remove dialog box, choose which option you want.

To add the column back to the report, click on the object in the Available Objects pane, and drag-and-drop to the new position on the report.

![]() If you have applied a sort order to the column prior to removal, you will need to re-apply the sort order when you add the column to the report.
If you have applied a sort order to the column prior to removal, you will need to re-apply the sort order when you add the column to the report.
Filtering Data on a Report
The Creating a Query section describes how to create a basic report, including the addition of parameters to filter the report data in Adding Filters to a Query. Alternatively, you also can filter report data on the Edit Report panel after running the query.
![]() When entering report filters on the Query Panel, the filter options are added to the query Analysis Center uses to retrieve report data from the database. Filtering at this level retrieves only the desired data, so the query will perform faster. Filtering on the Edit Report panel does not affect the actual records returned from the database, so initial report population will take longer. The primary advantage of filtering report data is the ability to do “on-the-fly” analysis of the data in the report. If the report should contain only a subset of the data, adding the filter on the Query Panel is recommended.
When entering report filters on the Query Panel, the filter options are added to the query Analysis Center uses to retrieve report data from the database. Filtering at this level retrieves only the desired data, so the query will perform faster. Filtering on the Edit Report panel does not affect the actual records returned from the database, so initial report population will take longer. The primary advantage of filtering report data is the ability to do “on-the-fly” analysis of the data in the report. If the report should contain only a subset of the data, adding the filter on the Query Panel is recommended.
The example below uses a report containing matter information from the Matters - Base info tab.
To Filter Data Using the Edit Report Panel:
- Create a new Analysis Center report by adding the Matter Name, Matter Number, Matter Type, and Matter Status objects.
- Click the
 Run Query button.
 - On the Edit Report panel, right-click on the Matter Type column, select the Filter submenu, and select Add Filter.

- On the Filter dialog box, select the value(s) from the list of available values and click OK.

The report results now filter on the selected values.
If you need to edit the filter, right-click the column that is filtered and select Edit Filter. To delete a filter, right- click the column that is filtered and select Remove Filter. Note that just as sorting could apply multiple sorts, additional columns may have filters applied as well.
Saving a Report
Once a report has been created, you can save the report as private or public. Private reports are only available to the creator, whereas public reports are available to all users. Selecting a category for a public report makes it available to the Reports module.
To Save a Report:
- On the Edit Report panel, click the
 Save button.
 - In the Name field in the Save Document dialog box, type a name for the report.
 The following special characters cannot be used in the report name: colon (:), double-quote (“), less than (<), greater than (>), pipe (|), forward-slash (/), ampersand (&), single quotation mark (’), back quote (`), question mark (?), pound-sign (#), or asterisk (*).
 - Click on the Public Folders tab.

- Navigate to the desired directory.
Note that Analysis Center reports may reside in a nested directory structure following these conventions:
- The root folder as defined by the Root BO Directory value in the Suite Manager BusinessObjects system settings (for example, bridgeway)
- A subfolder of the root folder from above matching the unique database identifier as defined by the Database Identifier value on the Database Properties Administrator page for Suite (for example, Suite8)
- A subfolder of the previous folder named Analysis Center
- A subfolder of the Analysis Center folder matching either the user's Suite login name (for private reports) or Shared Reports (for public reports)
- A subfolder of the previous folder matching the Suite application (either eCounsel or Secretariat)
After it has been saved, the report can be further modified. The report should be resaved after any changes are made to the report. - Following is an example of a directory that would be used for a public report.

- Following is an example of a directory that would be used for a private report.

![]() Check with your system administrator if you have any questions regarding which server to use, and-or which directory you should to use for either type of report.
Check with your system administrator if you have any questions regarding which server to use, and-or which directory you should to use for either type of report.
To Run a Saved Report from Analysis Center:
Once a report has been saved, it may be re-opened and reused at any time. On the Analysis Center dialog box, click on the report name in the appropriate section.
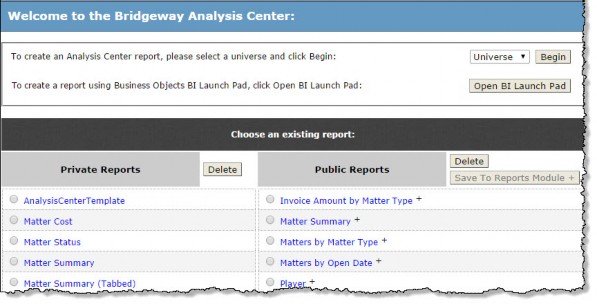
The Analysis Center report appears with data pre-populated from the time the report was previously run.
![]() Important Note: The report opens with the data from the last time the report was run. Click
Important Note: The report opens with the data from the last time the report was run. Click ![]() Refresh Data to load current data into the report.
Refresh Data to load current data into the report.
To Edit a Saved Report:
Once a saved report is opened, it may be modified.
- Switch to Design mode by clicking the arrow next to the Design button and selecting the With Data option.

The report is now open in edit mode and formatting changes can be made to it. - To change the data elements used on the report, click the
 Edit Query button.
 - On the Query Panel, add or remove data elements as desired, then click the
 Run Query button.
 - To overwrite the existing report, click Save on the Edit Report panel. To retain the original report, click the Document menu and select Save As. On the Save Analysis Center Report dialog box, save the report as described above.
Printing a Report
The Analysis Center print function on the Edit Report panel allows you to print to any device you have installed on your system.
To Print a Report:
- In Analysis Center, run a report.
- On the Edit Report panel, click the
 Print button.

Choose the appropriate settings. You will most likely want to change the page size (the default is the European A4 size).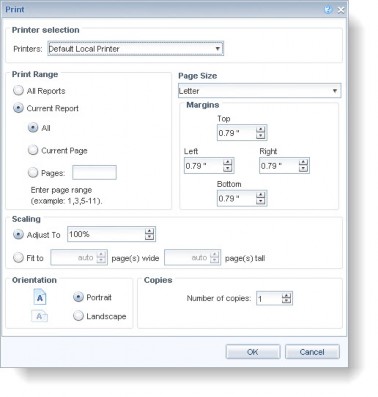
- When you are ready to print, click OK.
Exporting a Report
Finished reports commonly need to be distributed in electronic format to other individuals for analysis or saved on a shared network resource for archival purposes. In these cases, the report should be exported and saved in a supported file format. Analysis Center can save reports in Microsoft Excel (versions 1997-2003, or 2007), Adobe Acrobat PDF, a text file, and comma-separated value (CSV) formats.
To Export a Report:
- In Analysis Center, run a report.
- On the Edit Report panel, click the Data Access menu and then the Tools sub-tab. Select the
 Export Data button and then choose the export method.
- If you choose to export the report as a CSV file, you can format it with the following options.

- Choose a location for the document, name it, and click Save.
- On the Save As dialog box, select a location to save the file, change the filename if needed, and click Save. You will not receive a confirmation when the export is complete.