
Using Advanced Reporting
Adding a Section/Group
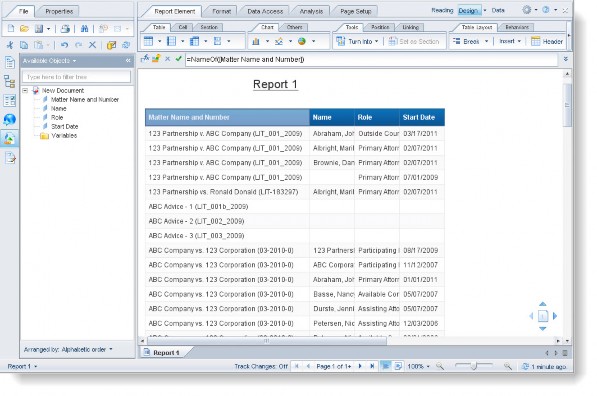
A common function of reporting is grouping data by a certain value on the report. For example, if you needed a report of all matter players grouped by the associated matter, you can easily create a report that lists all of the players from the eCounsel database. However, it may be more useful to include the matter associated with each player record, and organize the report so that all of the players are grouped by the associated matter.
To Group Results:
- Open Analysis Center, select a universe, and click Begin.
- In the Universe outline pane on the Query Panel, open the Matters folder, open the Base Info (Matter) folder, and add the
 Matter Name and Number dimension as result object.
 - Expand the Players folder under the Matters root folder, and add the following dimensions as result objects:
 Name
Name- Role
- Start Date
- Click the
 Run Query button.

The report is sorted by the first object in the results table, which is the Matter Name and Number column. This effectively groups the records by the associated matter. Note that matters containing multiple players appear multiple times.
To Create a Section:
To format the report so that the matter name appears only once, a section can be inserted. Right-click a cell in the Matter Name and Number column on the report, and select Set as Section.

Note that the Set as Section option is not available when you right-click in a header column.
The report is now grouped under a section heading containing the selection data (in this case, the Matter Name and Number), with the player data in the table below each grouping.

Now assume that you want the same report but would like to see all of the player assignments grouped by the individual player. The same report can be manipulated to provide a list of player assignments grouped by the individual.
Undo the matter grouping by clicking the ![]() Undo button on the toolbar, and then right-click a cell in the Name column and select Set as section.
Undo button on the toolbar, and then right-click a cell in the Name column and select Set as section.
The report is refreshed to display the player information grouped by the individual player. The other data, including the matter name, appears under the section header containing the player’s name.

Using Subreports
Complex reports often contain data from multiple sources that are not suited to organization in a single table. In a traditional reporting tool such as SAP Crystal Reports, reports can be sectioned so that data can be logically grouped together making the report easier to read and understand. This grouping is accomplished primarily using subreports, which aggregate data together in a separate section on the same report.
In Analysis Center, the concept is handled in one of two ways: by creating multi-table reports, or by creating tabbed reports.
Creating a Multi-table Report
Multi-table reports are single-page reports that contain information grouped logically in separate tables. Multi- table reports are best suited to reports that will be printed, as the information will appear in contiguous sections on a single report. The best way to create a multi-table report is by using an iterative approach. The iterative approach means to build each table on the report individually.
To Create a Multi-table Report:
- In the Universe outline pane on the Query Panel, open the Matters folder, open the Base Info (Matter) folder, and add the following dimensions as result objects:
- Matter Name and Number
- Matter Type
- Matter Status
- Open Date
- Click the
 Run Query button.
 - Name the table (for example, “Matter Summary”) and set Matter Name and Number as a section.

- Click the
 Edit Query button.
 - On the Query Panel, add a new group of objects to the report (such as Players information) and click the
 Run Query button.
 - On the Edit Report panel, note that the new objects do not appear automatically on the report. Instead of appending the new objects to the existing table, select the newly added objects (pressing the <CTRL> key allows you to click on multiple objects to select) and drag them to a blank space on the report. This will create a new table containing just the new object data.

- Format the new table as desired. For example, in the report above, the Players objects were dragged to the right of the matter base information.
- Repeat Steps 4-7 to add additional information to the report.
Creating a Tabbed Report
A tabbed report is a multi-page report that contains related data segregated into separate tabs. Tabbed reports are most useful for reports on a single record (such as a single matter or entity) and require a filter or prompt to limit the result set to a single record—if not, the information for multiple records will aggregate on the report tabs, showing co-mingled results from multiple records. The iterative report building approach works for building tabbed reports as well, except that each new table will be placed on a new report tab.
![]() A tabbed report must have a built-in prompt to restrict the report data to that related to a single record.
A tabbed report must have a built-in prompt to restrict the report data to that related to a single record.
To Create a Tabbed Report:
- In the Universe outline pane on the Query Panel, open the Matters folder, open the Base Info (Matter) folder, and add the following dimensions as result objects:
- Matter Name and Number
- Matter Type
- Matter Status
- Open Date
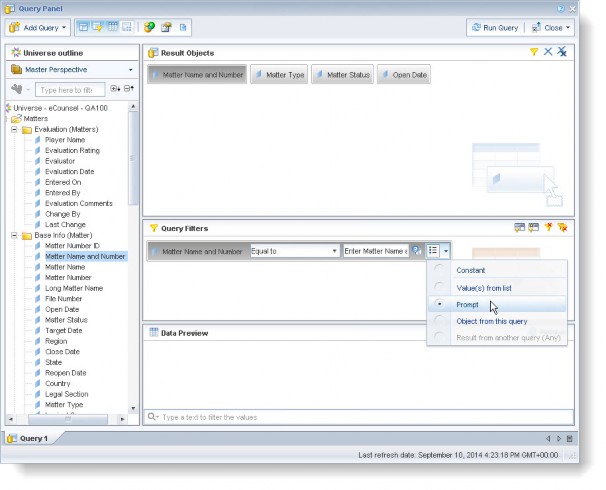
- Drag and drop the Matter Name and Number object into the Query Filters pane.
- Select an appropriate operator. In this example, specify a single value for the matter name by selecting Equal to from the middle drop-down list (list of operators).
- Click on the
 Define Filter Type button, and select Prompt.
- Click the
 Run Query button.
 - On the Prompts dialog box, double-click a matter from the list of values (or highlight a matter and move it over with the right arrow
 ), then click OK.
- Format the table, including adding sections (e.g., set Matter Name and Number as a section), naming the table (e.g., “Matter Summary”), resizing cells, etc.
To rename the report, either double-click the report tab (named “Report1” by default), or right-click it and select Rename Report.
In the Name value of the Rename Report dialog box, type a descriptive name such as “Matter Summary”. - Click the
 Edit Query button.
 - On the Query Panel, open the Players folder and add the Name, Role, and Start Date objects to the Result Objects pane and click the
 Run Query button.
 - On the Edit Report panel, note that the new objects do not appear automatically on the report. Instead of appending the new objects to the existing table, right-click the report tab and select Add Report. A new report tab appears.

- Right-click the new tab and select Rename Report. Type a descriptive name (in this case, “Players”).
- Select the newly added objects (pressing the <CTRL> key allows you to click on multiple objects to select) and drag them to the new report tab.

- Format the new table as desired.
- Repeat Steps 8-13 to add additional information to the report.
Adding Custom Variables
Analysis Center allows you to define custom variables for use with a report. A custom variable is a report object based on a user-defined formula; the formula can be used to achieve a nearly unlimited number of reporting effects, including but not limited to concatenating multiple values into a single field, performing mathematical functions on numeric data, or creating conditional values.
Concatenating Data
Assume for the purposes of grouping data, you concatenate the matter name and matter number into a single custom variable. Doing so keeps the name and number together in the section header, as opposed to treating them separately. To create a single field containing both data elements, follow the instructions below.
To Create a Variable to Concatenate Data:
- In the Universe outline pane on the Query Panel, open the Matters folder, open the Base Info (Matter) folder, and add the following dimensions as result objects:
- Matter Name
- Matter Number
- Matter Status
- Open Date
- Click the
 Run Query button.
 - When the report displays, decide where you want the variable to appear. If you want to replace an existing column with new variable data, select a cell in that column. If you do not want variable data to appear in the report, make sure no cells, columns, or rows are selected in the report.
- On the Edit Report panel, click the
 Add Custom Variable button.

- On the Create New Variable dialog box, type a name for the variable.
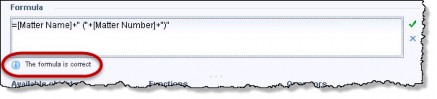
- Either double-click the Matter Name object in the Available Objects list, or drag-and-drop it into the Formula text box.

- For this example, in the Operators field, click the “+”operator, or manually type it into the Formula field.
- Add a space and an open parenthesis in quotes: “ (“.
- Type another “+”, and then drag-and-drop the Matter Number object onto the text box.
- Type another “+”, and then type the closing characters in quotes (for example, “)”).
- The formula should read as follows:
=[Matter Name]+" ("+[Matter Number]+")"

- Click the green Validate check mark to check the formula syntax. If there is an error, correct the formula (or verify that the report objects in this particular formula exist in the report) and re-validate.

If the syntax is correct, you will see an informational “The formula is correct” message below the Formula field.
- On the Create Variable dialog box, click OK.
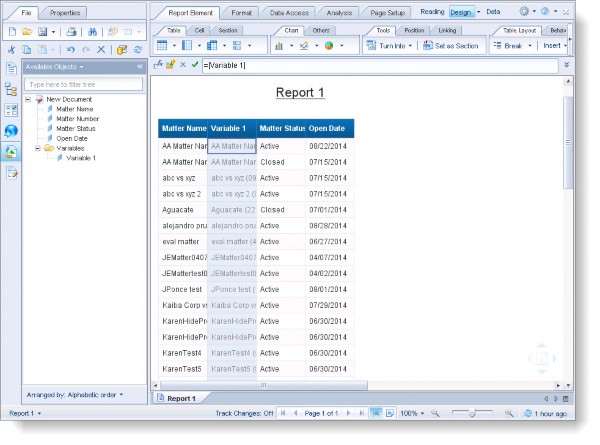
The new variable has replaced the selected cell’s data. It is also available for use in another column(s) in the report. It may be appended to the existing table or used to replace an existing cell in the table just like any other object.
Creating Conditional Values
Assume that your data design supports multiple status designations for matters that are not closed. For reporting purposes, you would like know simply whether a matter is in process or completed. You can create a custom variable that converts a matter status of “Open” or “Active” to “In Process”, and any other status to “Closed”.
To Create a Variable for Conditional Values:
- Decide where you want the variable to appear. If you want to replace an existing column with new variable data, select a cell in that column. If you do not want variable data to appear in the report, make sure no cells, columns, or rows are selected in the report.
- On the Edit Report panel, click the
 Add Custom Variable button.
 - On the Create New Variable dialog box, type a name for the variable.
- In the Formula text box, type the following:
=If(([Matter Status]="Open" OR [Matter Status]="Active");"In Process";"Completed") - Click Validate to check the formula syntax. If there is an error, correct the formula (or verify that the report objects in this particular formula exist in the report) and re-validate. If the formula validates, click OK.
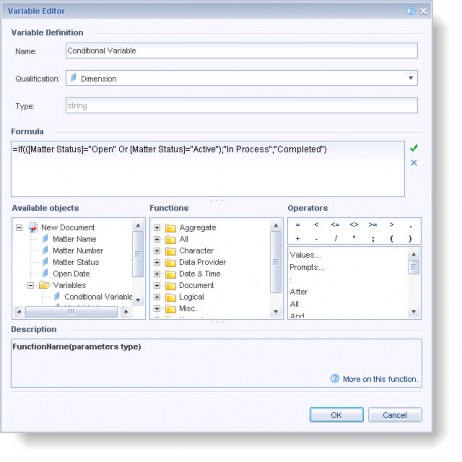
- On the Create New Variable dialog box, click OK.
The new variable is now available for use on the report. It may be appended to the existing table or used to replace an existing cell on the table just like any other object.

Creating Reports with Data from Multiple Modules
Analysis Center makes it possible to query and report on data from multiple eCounsel or Secretariat modules. For example, a report containing both matter player information and personal details about those players can appear on the same report. This data is stored in two separate eCounsel modules—player data in the Matters module and personal data in the People module. In order to correctly link data from two separate modules, two separate queries can be built and linked together using the object merge functionality.
Merging allows Analysis Center to include the same object on two separate queries, or data providers, then merge those identical objects so that the query results from the two separate queries are linked together properly.
To Create a Report with Data from Multiple Modules:
- Open Analysis Center, select a universe, and click Begin.
- In the Universe outline pane on the Query Panel, open the Matters folder, open the Base Info (Matter) folder, and add the
 Matter Name dimension as result object.
 - Open the Players folder under the Matters folder, and add the following dimensions as result objects:
 Name
Name Role
Role
- Right-click on the data provider tab (named “Query 1” by default) and select Rename. You can also double-click the tab to rename it. Type a descriptive name such as “Player” and click OK.

- Run the query and then edit the query again (with the
 Edit Query button).
 - Right-click the tab again and select Duplicate. This action creates an exact copy of the current query. You will get an error message if you try to duplicate the query without running the first query.
- Right click the new tab and select Rename. Type a descriptive name such as “Personal Data”.
- With the new Personal Data tab open, remove the existing Result Objects dimensions from the query.
- In the Universe outline pane on the Query Panel, open the People folder, open the Base Info (People) folder, and add the following dimensions as result objects:
 Name
Name Gender
 Admin #
- Click
 Run Queries.

- Choose an appropriate option on the Add Query dialog box.

- Click the top Data Access tab and then click the
 Merge button.

- In the Available Objects pane, merge the two objects containing the same data (in this case, the Name objects) by selecting both objects. To select both objects, press and hold the <CTRL> key and clicking each object. Click OK.

Where appropriate, the additional data appears on the report. - Click a cell in the Name column, and select Set as Section to group the data by player.

Using this technique, data from the Matters module can be added to a report using matter data, so long as the two separate data providers share a single common data object.
![]() This technique is not necessary to link matter and invoice data, as data in these modules is linked in the universe design.
This technique is not necessary to link matter and invoice data, as data in these modules is linked in the universe design.
Adding Data from Another Module to a Report
Because invoices in eCounsel are directly related to matters, the invoice and matter data is integrated in the eCounsel universe, allowing you to add matter objects to invoice reports without resorting to the techniques described above. The example below creates a basic matter cost report with information from the Invoices module.
To Create a Report with Matter and Invoice Data:
- Open Analysis Center, select a universe, and click Begin.
- In the Universe outline pane on the Query Panel, open the Invoices folder, open the Base Info (Invoice) folder, and add the following dimensions as result objects:
 Vendor
 Invoice #
- Open the Invoice Matter folder (from the Invoices parent folder), and add the following dimension and measure as result objects:
 Matter Name
 Total Billed
- Click the
 Run Query button.
 - To group by the matter, right-click a cell in the Vendor column, select the Break submenu, and select Add Break.
- Right-click a cell in the Total Billed column, select the Format Number submenu.
- On the Format Number dialog box, click on the Default tab. Select the format with the $ and the 2-digit decimal precision – $1234.57; ($1234.57), and then click OK.
- Right-click on the Total Billed column, select the Insert submenu, and select Sum.

Each matter section is now summarized.

- Click the
 Edit Query button.
 - In the Universe outline pane on the Query Panel, open the Matters folder, open the Base Info (Matter) folder, and add the following dimensions as result objects:
 Matter Type
 Matter Status
- Click the
 Run Query button.
 - Select the newly added objects (pressing the <CTRL> key allows you to click on multiple objects to select) and drag them to far right corner of the first section. You should see a small rectangle appear.

The new matter is added to the existing invoice report.
