Reporting on Numeric Data
Certain reporting, such as invoices (in eCounsel) or securities/ownership (in Secretariat) involve numeric values. Reporting on numeric data introduces formatting challenges and arithmetic functions not used in text reporting. This chapter introduces techniques useful in creating financial or numeric reports in Analysis Center.
Understanding the Basics
Before creating reports with numeric data, you should understand how the data is stored in eCounsel or Secretariat. For example, in eCounsel, it is important to understand how the various amount fields on a particular invoice are related so that the proper amounts appear on the report.
The Adjusted Billed field contains the total amount of the invoice in the billed currency of the vendor; the Adjusted Base field converts the billed amount to the base currency of the entity as long as a conversion rate has been entered for the invoice. On the Invoices Base Info tab, the following amounts are shown:
- The Total Billed field (Original Amount in the universe) contains the full amount of the invoice in the billed currency.
- The Total Discounts Billed field (Total Discounts in the universe) contains any discounts applied to the invoice either at the invoice-level or at the invoice line item level in the billed currency.
- The Total Adjustments Billed field (Total Adjustment in the universe) contains the amount of all other adjustments to the invoice that have been made manually (excluding discounts).
- The Adjusted Pre-tax Billed field contains the Total Billed minus Total Discounts Billed and Total Adjustments Billed in the billed currency.
- The Total Tax Billed field contains any taxes applied to invoice line items in the billed currency.
- The Adjusted Billed field contains the Adjusted Pre-tax Billed minus the Total Tax Billed, and is the amount to be paid in the billed currency.
- The Adjusted Base field (Invoice Amount in the universe) contains the Adjusted Billed times the Conversion Rate to express the amount to be paid in the base currency used by the entity.
Each of these fields in eCounsel has a corresponding object in the universe noted above.
At the matter level, these same fields exist as the part of the total invoice amount allocated to a particular matter. Similar to the Invoices Base Info tab, the Invoices Matter tab contains the same fields as above. Each of these fields in eCounsel has a corresponding object in the universe for the matter level.
![]() eCounsel supports the ability for a vendor to include charges for multiple matters on a single invoice (referred to as a split invoice). If your organization supports split invoices, the sum of the individual matter invoice amounts equals the total invoice amount. If your organization does not support split invoices (i.e., if each invoice contains only charges for a single matter) then the matter invoice amount and invoice amount are equal. Knowing whether your organization supports split invoices is important when creating invoice reports.
eCounsel supports the ability for a vendor to include charges for multiple matters on a single invoice (referred to as a split invoice). If your organization supports split invoices, the sum of the individual matter invoice amounts equals the total invoice amount. If your organization does not support split invoices (i.e., if each invoice contains only charges for a single matter) then the matter invoice amount and invoice amount are equal. Knowing whether your organization supports split invoices is important when creating invoice reports.
The Invoice Detail subtab on the Invoices Matter tab (accessed by clicking the top Invoices link, double- clicking an invoice, and then clicking the side Matter tab) contains the Adjusted Based field, which is the itemized amount for a particular line item on the invoice after discounts and adjustments. Invoice detail amounts are associated with a particular matter on an invoice. The sum of all line items equals the Adjusted Pre- tax Billed amount on the Matter tab.
The Matter Tax Detail subtab on the Invoices Matter tab contains the taxes for all expenses and fees for invoice line items in the billed currency. The sum of all taxes equals the Total Tax Billed amount on the Matter tab.
The Invoice Allocation subtab on the Invoices Matter tab contains the part of the matter invoice amount that is allocated to a particular business unit associated with the matter. The sum of all allocations equals the Adjusted Base amount on the Matter tab.
When creating invoice reports, be sure to think about which amounts need to appear on the report and to choose only the amount fields required. Also realize that fields in billed currency should not be intermingled with fields in base currency.
Grouping Using Breaks
Analysis Center features another method of grouping data, called a break, which is especially useful for financial reports. A break, as the name implies, causes the table to break on unique values in the selected column. Unlike the Set as Section menu command, inserting a break does not remove the selected column from the table; instead a blank row is added to the bottom of each break in the table so that arithmetic functions (e.g., sums, averages, etc.) may be inserted.
For example, when using the Set as Section menu command, an invoice report can appear as follows.
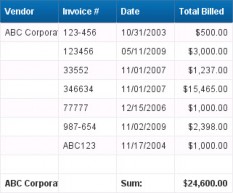
Whereas, setting a break causes the same invoice report to display as follows.
To create a break, right-click in a cell (of a column you want to sort) and choose Break and then Add Break.
To Create an Invoice by Vendor Report:
- To create a basic invoice report that shows invoices by vendor, create a new query in Analysis Center.
- In the Universe outline pane on the Query Panel, open the Invoices folder, open the Base Info (Invoice) folder, and add the following dimensions and measure as result objects:
 Vendor
 Invoice #
 Date
Date Total Billed
- Click the
 Run Query button.
 - On the Edit Report panel, right-click a cell in the Vendor column, select the Break submenu, and select Add Break.
- Right-click a cell in the Total Billed column, select the Format Number submenu.
- Select the format with the $ and the 2-digit decimal precision, listed as – $1234.57; ($1234.57), and then click OK.
- Right-click on the Total Billed column, select the Insert submenu, and select Sum. Each section now has a summary of the total billed.
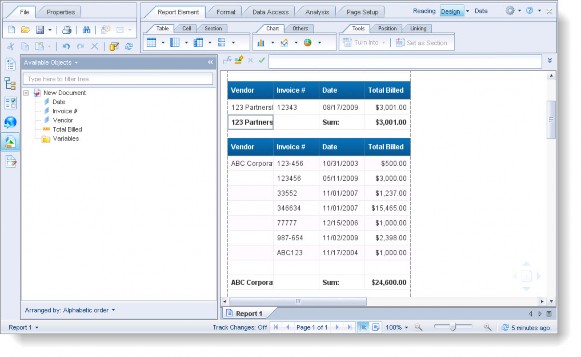
The sum of the amount for each vendor is added to the bottom cell in the column.
To Create a Cost by Matter Report:
Next, create a basic report for costs by matter. The objects required for the report depend on the level of detail required (e.g., simple aggregate costs vs. costs by type). This example just uses the matter name and matter invoice amount.
- To create a cost by matter report, create a new query in Analysis Center.
- In the Universe outline pane on the Query Panel, open the Invoices folder, open the Invoice Matter folder, and add the following dimension and measure as result objects:
 Matter Name
 Total Billed
- Click the
 Run Query button.
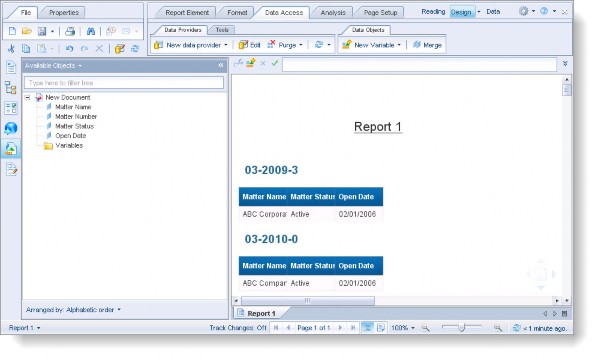
By default, Analysis Center will suppress duplicate rows (with the Matter Name object) and sum associated values in columns with numeric data. Note that each Matter Name is listed once regardless of the number of invoices, and the Total Billed amounts are automatically totaled.

To Modify the Report:
To modify this report to show the individual matter amounts broken out by the invoice and sum these amounts for each matter, follow the steps below.
- On the Edit Report panel, click the
 Edit Query button.
 - In the Universe outline pane on the Query Panel, open the Invoices folder, open the Base Info (Invoice) folder, and add the following dimensions as result objects:
 Vendor
 Invoice #
- Click the
 Run Query button.
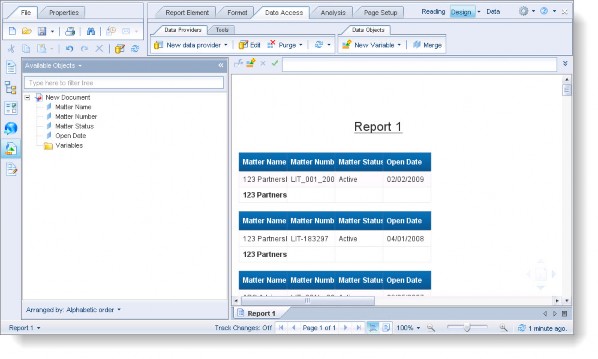
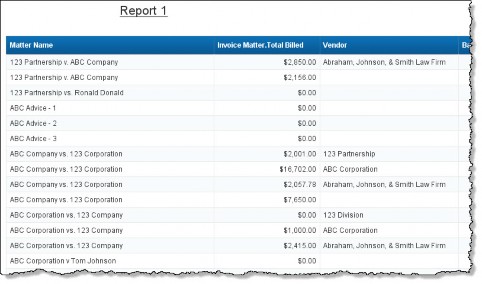
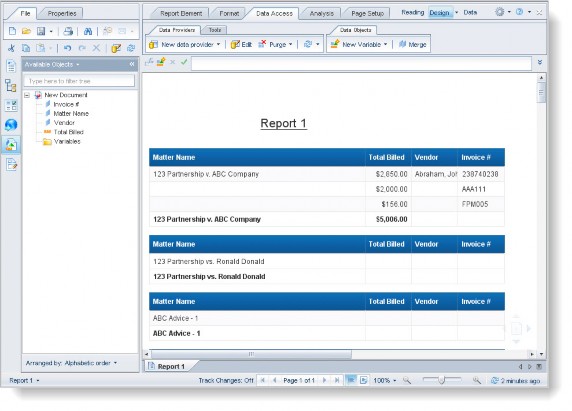
 - On the Edit Report panel, add the Vendor and Invoice # objects as columns to a place in the table (with the existing Matter Name and Total Billed columns). Notice that the when the new objects are added, the individual rows are now rendered on the report.
- Right-click a cell in the Matter Name column, select the Break submenu, and select Add Break.
- Right-click a cell in the Total Billed column, select the Format Number submenu.
- Select the format with the $ and the 2-digit decimal precision – $1234.57; ($1234.57), and then click OK.
- Right-click a cell in the Total Billed, select the Insert submenu, and select Sum. The sum of the amount for each vendor is added to the bottom cell in the column.
Creating Graphs and Charts
Analysis Center also features the ability to quickly and easily convert numeric data in tables into graphs and charts. Pie charts were designed to use measures.
![]() If you do not use a measure when you create a chart, the chart will appear in greyscale and will not be readable.
If you do not use a measure when you create a chart, the chart will appear in greyscale and will not be readable.
To Create a Graph/Chart:
- Create a new query in Analysis Center.
- In the Universe outline pane on the Query Panel, open the Invoices folder, open the Invoice Matter folder, and add the following dimensions:
 Matter Name
From within the Invoice Matter folder, open the Invoice Matter Detail folder, and add the following dimension and measure:
 Cost Type
 Total Billed
- Click the
 Run Query button.
 - On the Edit Report panel, right-click the Matter Name cell, and select Set as Section.
- Right-click a cell within the Total Billed column, select the Format Cell submenu.
- Click on the Number option on the left and select the format with the $ and the 2-digit decimal precision:
$1234.57; ($1234.57), and then click OK. - Hover over the top of the table until you get the multi-select arrow
 , and then right-click and choose the Turn Into and then select Pie Chart.
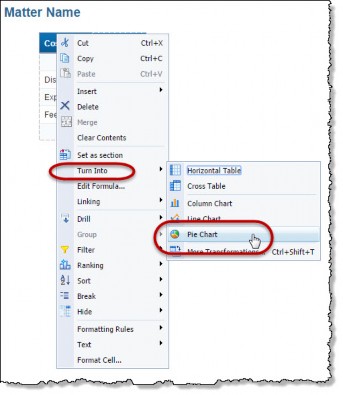
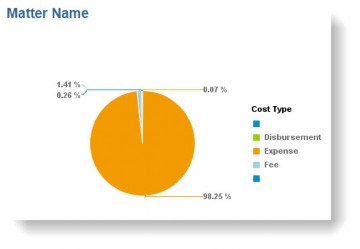
The data is transformed into a pie chart.
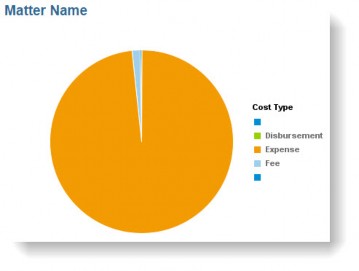
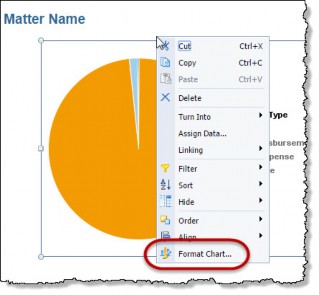
- To show the data with additional labeling, hover over the top of the chart until you get the multi-select arrow
 , and then right-click and choose the Format Chart option at the bottom of the context menu.
On the Global chart area of the Format Chart dialog box, click on the left Area Display option, then select the Data Label Displaying Mode checkbox, and click OK.
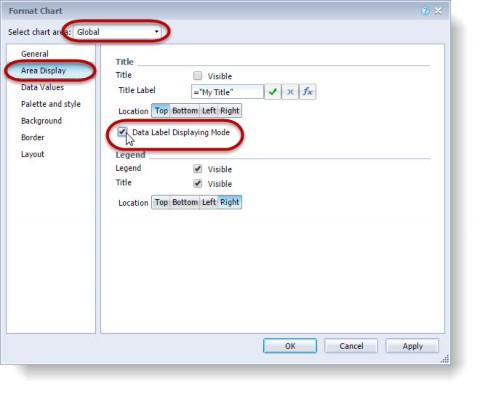
The pie chart now shows the data with additional labeling.