
Introduction to TeamConnect Essentials Reporting
Introduction
This document provides an introduction to TeamConnect Essentials Reporting tool (also referred to as TCBI or Reporting). On this page you'll find basic navigation tips, other helpful tips & tricks, and a few best practices to keep in mind if you are running, filtering, or editing reports and dashboards.
Let's get familiar with the terminology before we dig in
- Dashboards - Dashboards are categorized reports made up of different widgets (for example, Matter Financials). Access different dashboards on the far left side of the Reporting page.
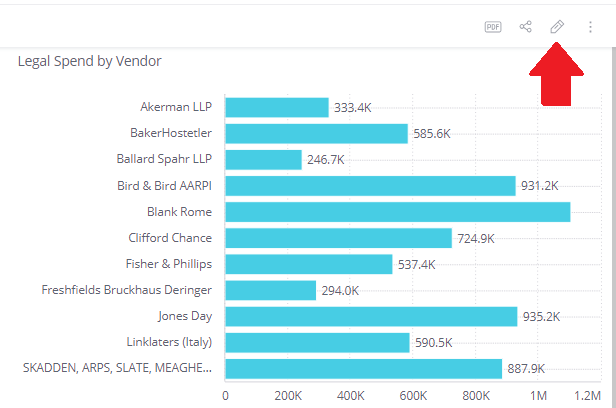
- Widgets - Widgets are visual representations (like graphs and charts) that display different categories of a dashboard (for example, budget vs spend by vendor is a widget within a Dashboard).
- Report Designer - Report Designers are users added to the Report Designer security group. These users are able to manipulate the data displayed in dashboards and widgets at a global level and share it with and apply it to other employees and users.
- Report Viewer - Anyone added to the Standard Legal User group is considered a Viewer and can access the Reports tab with all respective dashboards.
Types of Reporting Users
Typically a general counsel member would be running and managing reports in TeamConnect Essentials. In the Reporting tab, users are classified as either a Viewer or a Designer (these user types are described below)
| Viewers have the following rights | Designers have the following rights |
| Viewing the reporting page | Creating new dashboards and reports (in which case they become the owner of the dashboard) |
| Viewing reporting dashboards, widgets, or folders for which they have permission and have been shared with them | Modifying or deleting an existing report |
| Cosmetically interacting with dashboards or widgets | Duplicating an existing report |
| Downloading files for dashboards and widgets | Modifying the orientation/layout/structure of widgets within the dashboard |
| Receiving scheduled reports (users who want to get schedule reports must have view-only rights for reporting) | Modifying view permissions for dashboards |
| Modifying any of the dashboard & widget filters that have been made available to them by the owner of the dashboard (these changes are stored locally unless an Owner makes a change, republishes it, and refreshes and the Viewer refreshes as well) |
How do I know if I'm a Viewer or Designer?
Most users will be in Viewer mode, and a select few can toggle between Viewer and Designer mode. To see which view you have, navigate to the Reports page and look at the menu icons in the top right corner of the screen.
A Pencil icon indicates Viewer.
Navigation Basics
This section covers navigation tips between the Reporting tool and same-page dashboards (for example, the Matter page contains a Matter Breakdown dashboard).
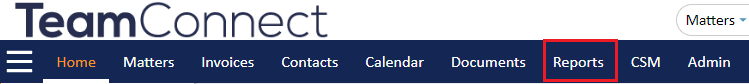
Dashboards can be accessed in the Reports tab found on the top menu bar.
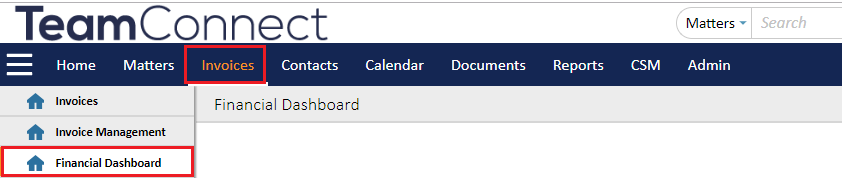
or on the Home and Invoice pages.
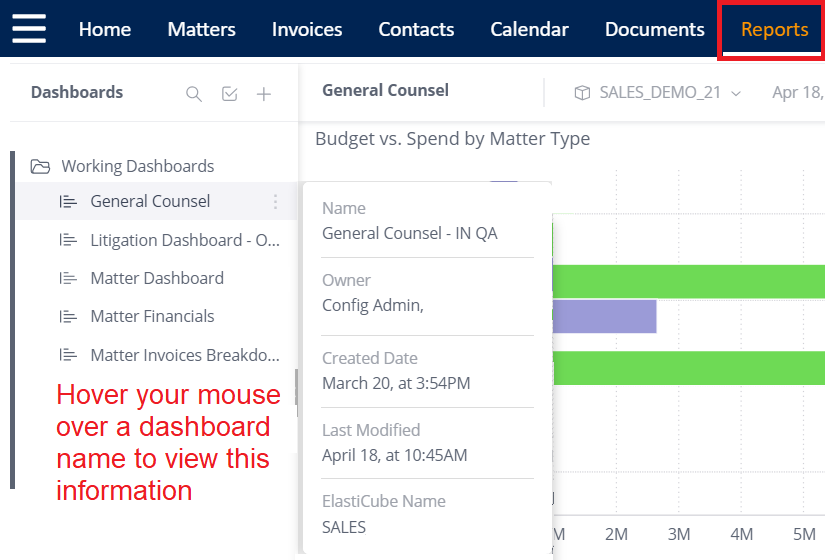
Hover-over information
|
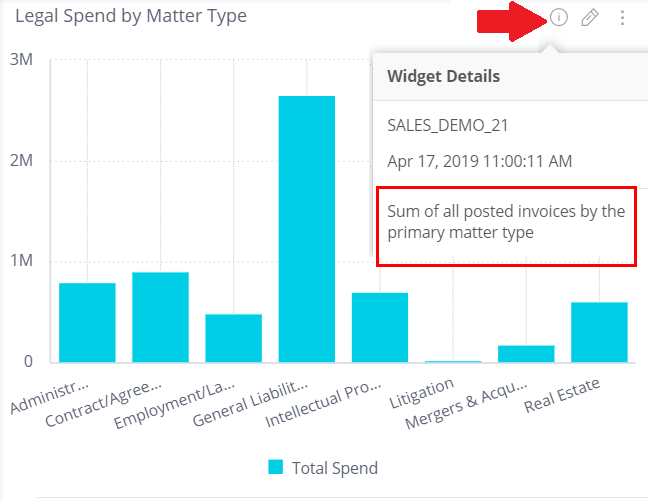
Hover over widget icons to quickly see the following information:
|
|
Dashboard and Widget Menus
|
Click the 3 dots next to a dashboard's name to open this menu. From here you can do the following:
|
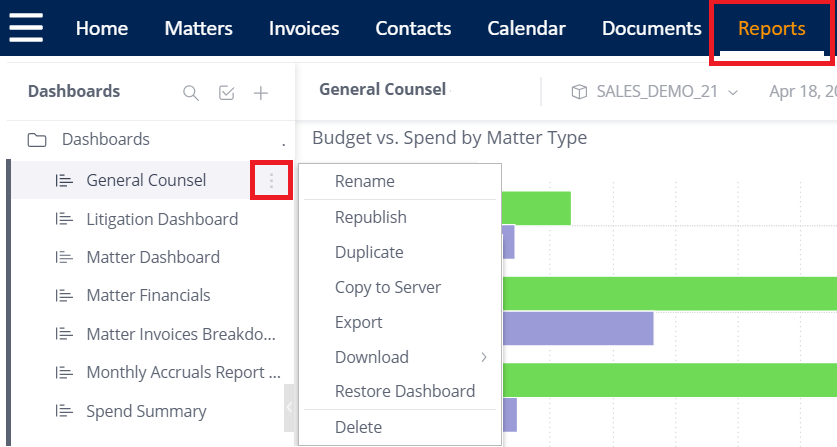 |
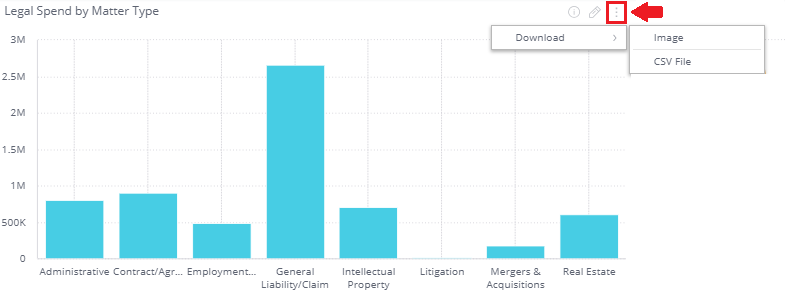
Click the 3 dots on any widget to download that widget into a .CSV or Image format.
Navigating the Filters
The dashboards are very interactive and reactive. This means you can click on almost any "piece" of a report to highlight that specific piece of information. For example, in the Legal Spend by Matter dashboard, you can click on the General Liability section in the bar chart and the other widgets will highlight information specific to what you clicked on.
Learn more about filtering on this page!
*ALWAYS CLEAR YOUR FILTERS*
Filters will save even if you navigate away from a page and data will be skewed if the filter isn’t cleared.
Tips & Tricks
Security and Permissions
- You can only see reports you've been given permission to see. If you don't have access to a report, reach out to your system administrator so they can put you in the right security group. Learn more about security groups here.
Navigation and Refreshing
- Clicking your browsers Refresh button will land you back on the main Reporting page. Do not click this button if you are in the middle of editing or filtering a dashboard.
- Make widgets full screen by clicking the pencil edit icon found on any widget.
Filtering and Editing
- Clicking the information icon on a widget will show you the following information:
- the last time a widget was refreshed/updated
- a description of the information in the widget
- learn more about filtering and editing here
- Changes to any dashboard will only affect your personal reports, unless you are a Report Designer and intentionally share edited dashboards with other users.
- Learn more about editing dashboards and applying filters here.
Downloading
- Download dashboards and widgets into various formats. Find out how, here.
- Make widgets full screen before downloading them. Find out how, here.
Quickly view a dashboard's description and purpose
Click the widget details information icon on any dashboard to open a small pop-up that contains a brief summary or description of the information displayed in the dashboard.
FAQ
When to use the Reporting Tool vs a Power Search
Use the Reporting Tool when:
- You need graphical report visualizations and dashboards
- You need detailed information regarding matter and invoice spend
Use Power Search when:
- You need quick, immediate insights (also real time)
- Your reporting requirements include Documents, History, Expense, and Tasks
- You need a list-type reporting
- You need field-level search
- You need complex tabular reports
- Daily Reports on dynamic data
Learn more about using Power Search here.
Why are the number of records not matching on a single report?
Why does information appear on the report that does not seem accurate?
Verify the following:
- When was the last data sync? - The data will sync every 2 hours. If you have recently added new information it may not show up until the next data sync.
- Has there been user security or access changes? - Do you have the right permissions to view the dashboard or report?
- Does the user have access to all of the matters that may be linked to the report? - You may not be able to view reports on matters, invoices, budgets, etc. that you don't have permission to see
- Is a filter on the report omitting some records? - Be sure to clear all of your filters before performing a new search or modifying a dashboard. Filters do not automatically clear if you navigate away from a page and come back.
- Did the right field get reported on? - It is important that you really understand your data and know what question you're trying to answer before you run a report or modify a dashboard.