
Appenders
Overview
Appenders are definitions of logs. They are classified according to the type of output they generate and whether they are defined for system or audit logging.
Although many features of appenders and loggers are configured in Designer, there are some features that are controlled by the Admin tab in the main TeamConnect user interface. These Admin features include:
- Turning loggers on and off
- Selecting the severity levels that generate log entries
When the TeamConnect application starts running, all logs defined by active appenders start to log generated messages. When you define a new appender or make changes to an existing appender, the changes take effect the next time you restart TeamConnect on the application server. When you delete an appender, the log continues to be generated until you restart TeamConnect.
You can define the following types of appenders which generate logs in corresponding output formats:
- File Appenders - Define logs that capture messages in a text file as they are generated by the system.
- SMTP Appenders - Define logs to be sent by email when a log event and when a severity of Error or higher is logged to a buffer.
- Socket Appenders - Define logs that transmit logger messages to a port on a remote host.
If you need a system log that only logs messages for a certain area of TeamConnect, such as custom blocks, you can associate the appender with the corresponding logger. For more details, see Loggers.
In the logging process, loggers perform the logging operation and capture event message data. Different types of appenders can be defined to physically store the event message data. File appenders or log files are the most common appenders. In addition, appenders are organized in two different ways, by data content and by data format or distribution.
Types of Logs in TeamConnect
In the area of log data content, there are two types of logs in TeamConnect:
- System Appenders - Record what TeamConnect is doing in the background by capturing messages generated by the system. This can be useful for debugging or when customizing the application.
- Audit Appenders - Track user activity, which may be necessary to meet certain policies or compliance regulations regarding user activity.
Division of Logging Functionality
TeamConnect logging features are divided between the Admin and Designer areas. In the Admin area, you can:
- View file appenders (log files).
- Clear or delete file appenders (log files).
- Change logging severity levels (for loggers). For example, change from Error message tracking level to Debug message tracking level if you need additional details for troubleshooting a TeamConnect component.
In the Designer area, you can define new log appenders (log files or email notifications), edit existing appenders, or toggle audit loggers on/off.
Note: TeamConnect logging uses the reload4j® API. However, Log4j 2 API is also available to support some third party integrations.
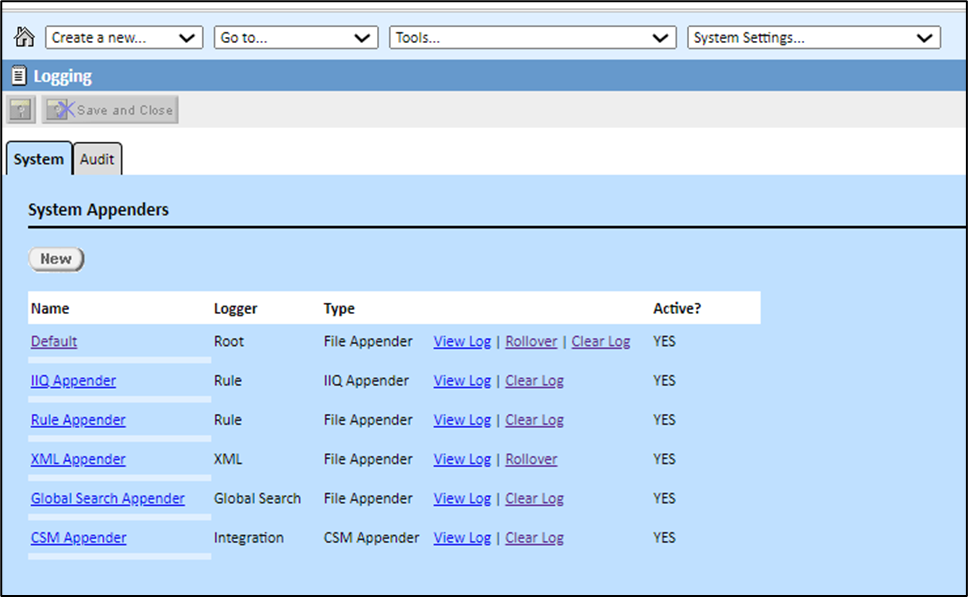
Default Logs and Appenders
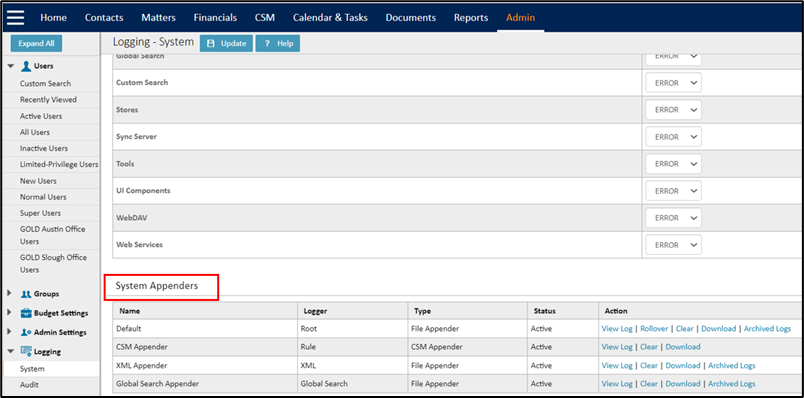
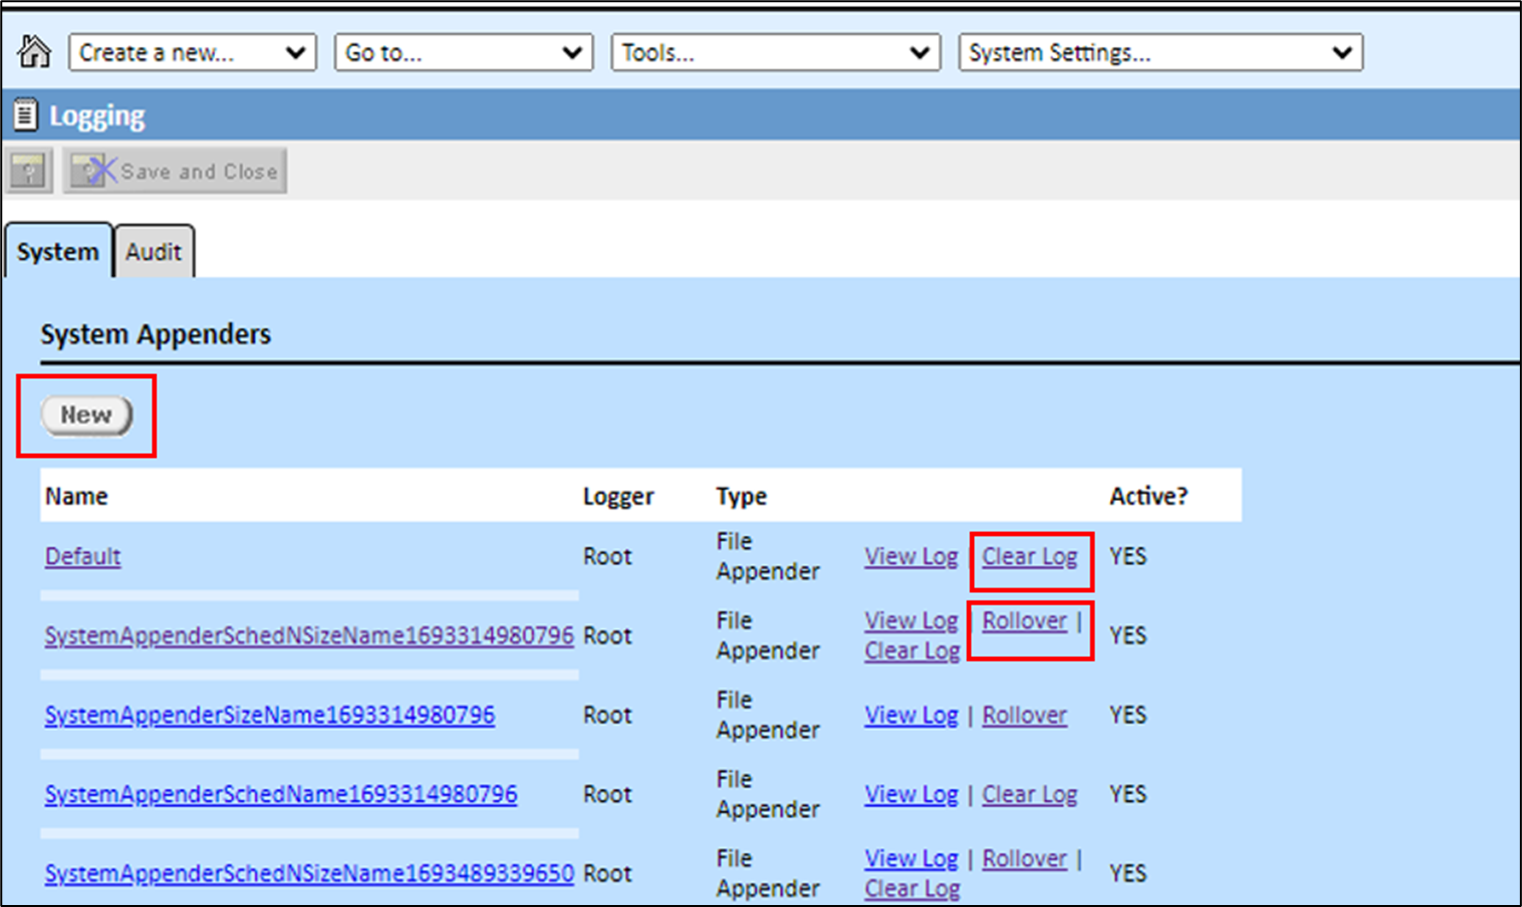
By default, TeamConnect has several active file appenders (log files in text format). These files are stored in the location specified for log folders at the time when TeamConnect was installed. There are three default logging appenders:
- Default (for system logging)—Logs all of the messages that are generated by all of the system loggers and writes them to the system.log file.
- XML Appender — Logs messages regarding XML requests, according to the level selected for the XML logger, and writes them to the xml.log file.
- Default (for audit logging) — Logs messages from all active audit loggers and writes them to the audit.log file.
Note: If Collaborati Spend Management is installed on your system, the CSM Appender is installed by default.
For information about how to view the default logs, see Viewing Logs.
For general instructions on defining all types of appenders, see one of the following:
- For system logging, see Defining System Appenders.
- For audit logging, see Defining Audit Appenders.
Note: If Collaborati Spend Management is installed on your system, the Collaborati Appender is installed by default.
Working with Logs
From the Admin Logging area, you can perform the following:
For additional information about creating and editing appenders, see Appenders.
Viewing Logs
The system and audit logs generated by file appenders are stored on the TeamConnect server. You can view logs by:
- Clicking a View Log link from TeamConnect.
- Opening the file on the TeamConnect server.
To view a log file
- Click the Admin tab.
- Click the Logging link under the tab bar.
- To view a system log file
- Click the System link from the left pane.
The System Logging page displays. - From the System Appenders section, locate the name of the log you want to view and click the corresponding View Log link.
- Click the System link from the left pane.
- To view an audit log file
- Click the Audit link from the left pane.
The Audit Logging page displays. - From the Audit Appenders section, locate the name of the log you want to view and click the corresponding View Log link.
- Click the Audit link from the left pane.
- The current log file for the log you selected is displayed in a new browser window. The most recent log events are listed at the bottom of the log file.
Things to Remember
- If a log file is very large, clicking the View Log link might cause a lockup in your browser session as it tries to transfer the large amount of data from the server. If this is a concern, right- click the View Log link, then choose context menu item Save Link As, then save the log to a file on a local disk drive. Open that local file with your browser.
- To view the latest log messages, press F5 or click your browser's Refresh button.
- For both System Appenders and Audit Appenders, if TeamConnect is running on a cluster of application servers, a drop-down list to the left of the View Log link allows you to choose the specific node whose log you wish to view. Node names consist of a machine name, followed by a numeric process ID.
- The log location is specified using the app.logFolder parameter in the Web Application Deployment Descriptor when TeamConnect is installed.
Default TeamConnect Log Folders
If you did not update the Log Folder field (app.logFolder parameter) when updating the teamconnect.properties file using the TeamConnect Installer, you can find TeamConnect logs in the following locations:
- For Apache Tomcat (Linux)—/<Apache_HOME>/bin/logs
For example:
/opt/tomcat/apache-tomcat-6.0.16/bin/logs - For Apache Tomcat (Windows)—C:\<Apache_HOME>\logs
For example:
C:\Program Files\Apache Software Foundation\Tomcat 6.0\logs - For WebLogic (Linux)—<WebLogic_Home>/user_projects/domains/<domain_name>/logs
For example:
/opt/bea/user_projects/domains/Mitratech/logs - For WebSphere—<WebSphere_Home>/AppServer/profiles/<profileName>/logs
For example, on Windows:
C:\WAS61\WebSphere\AppServer\profiles\AppSrv02\logs\
Managing Log Files for Multiple TeamConnect Instances on the Same Tomcat Server
When multiple TeamConnect instances are deployed on the same Tomcat server, the log files should be renamed according to the respective instance. This ensures that logs are captured based on the parameters set for each specific instance.
To understand how to rename log files, follow these steps:
| Instruction | Screen capture for reference |
|---|---|
|
 |
|
 |
|
 |
|
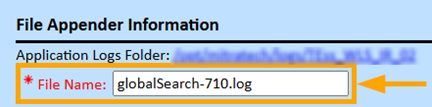
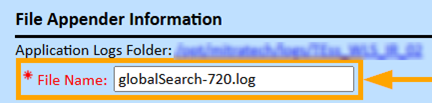
For Example |
For TCE 7.1.0, rename the file name to “globalSearch-710”. For TCE 7.2.0, rename the file name to “globalSearch-720”. |
| This way, logs remain properly categorized for each TeamConnect instance. |
Clearing Logs
For troubleshooting or maintenance purposes, you can manually clear the contents of a log. Clearing a log is different from rolling over a log in that the existing contents of the log will be deleted and not archived to a back-up file.
For example, one scenario in which clearing a log is useful is when you are trying to isolate the log messages related to a specific functional issue. You might clear a log, change the related logger's logging severity level to DEBUG, and then try to reproduce the issue. Afterward, the log would most likely isolate the event messages that can help troubleshoot the issue.
To clear a log file
- Click the Admin tab.
- Click the Logging link under the tab bar.
- To clear a system log file
- Click the System link from the left pane. The System Logging page opens.
- From the System Appenders section, locate the name of the log you want to clear and click the corresponding Clear Log link.
- To clear an audit log file
- Click the Audit link from the left pane. The Audit Logging page opens.
- From the Audit Appenders section, locate the name of the log you want to clear and click the corresponding Clear Log link.
- To view any new log messages, click the corresponding View Log hyperlink.
Changing System Logging Levels
Each message that can be written to a log has an associated log level that indicates the severity of the issue that caused the message to be written to the log. You can specify what severity of messages you want logged for each logger (or TeamConnect component).
Note: This is a system-wide setting. When you set a logger to a specific log level, you are specifying the most verbose severity level of messages that you want written to appenders defined for that logger. Although there is an analogous setting in the appender definition for log threshold, the logger's logging level overrides the log threshold.
To set the system logging level
- Click the Admin tab.
- Click the Logging link under the tab bar.
- To change a system logger's logging level
- Click the System link from the left pane.
- From the System Loggers or Detailed System Loggers section, scroll to a logger. From the corresponding Level drop-down list, select a logging level:
- Debug — Minor, frequent events in TeamConnect.
- Info — Significant, frequent events in TeamConnect.
- Warn — Minor issues external to TeamConnect.
- Error — Serious issues that are usually associated with a Java exception.
- Fatal — Rarely used in TeamConnect.
By default, system logger levels are set to Error, but you can adjust the severity based on the type of information you need to be captured in your logs.
See System Loggers and Detailed System Loggers for a description of the system loggers that come with standard TeamConnect.
- Click Update.
Your changes take effect immediately. All appenders defined for these loggers are now logging messages according to the log level that you have specified, and according to each appender's threshold.
Viewing, Clearing, and Rolling Over Logs
Viewing Logs Generated by File Appenders
The system and audit logs generated by file appenders are stored on the web server in a location that is specified when TeamConnect is installed. If you have access to the web server, you can directly view the logs on the server.
If you do not have access to the web server, you can view the logs directly in TeamConnect using the View Log hyperlink that is provided for each file appender.
Tip: To find out where your logs are stored, see the path displayed in the Application Logs Folder field in a file appender screen.
The log location is specified using the app.logFolder parameter in the Web Application Deployment Descriptor when TeamConnect is installed.
To view a log file
-
On the Admin menu bar in the System Settings drop-down list, select either System Logging or Audit Logging, depending on the type of log you want to view.
The Logging screen opens, with the corresponding tab displayed by default.

- In the System Appenders (or Audit Appenders) section of the tab, locate the name of the log you want to view and click the corresponding View Log hyperlink.
The current log file for the log you selected is displayed in a new browser window. The most recent log events are listed at the bottom of the log file. - To view the latest log messages, press F5 or click your browser's Refresh button.
Clearing Logs Generated by File Appenders
If the Rollover Policy field of an active file appender is set to Rollover on schedule, you can manually trigger the removal of the current log entries in a log file and start logging again in an empty file.
To clear a log file
- On the Admin menu bar in the System Settings drop-down list, select either System Logging or Audit Logging, depending on the type of log you want to clear.
The Logging screen opens, with the corresponding tab displayed by default. - In the System Appenders (or Audit Appenders) section of the tab, click the Clear Log hyperlink next to the file appender log you want to clear.
The current log entries in the log file are removed and logging begins in the empty file. - To view any new log messages, click the corresponding View Log hyperlink.
Rolling Over Logs Generated by File Appenders
If the Rollover Policy field of an active file appender is set to Rollover on size, you can manually trigger the rollover of the current log file and start logging again in new file.
To clear a log file
- On the Admin menu bar in the System Settings drop-down list, select either System Logging or Audit Logging, depending on the type of log you want to clear.
The Logging screen opens, with the corresponding tab displayed by default.
- In the System Appenders (or Audit Appenders) section of the tab, click the Rollover hyperlink corresponding to the file appender log you want to roll over. The current log file is rolled over and logging begins in an empty file.
- To view any new log messages, click the corresponding View Log hyperlink.
To utilize the XML layout, you need to create the necessary files to use the XML output as content that is pulled in and formatted correctly.
Log Rollover Access
Note: Introduced in TCE 7.1 version.
Earlier versions of TeamConnect (TCE 7.0 and older versions), the user did not have certain functionality where they could roll over logs and view them from TeamConnect. To address this, a new feature is introduced in which the user can go to TeamConnect and click on the archive logs to determine which logs were rolled over.
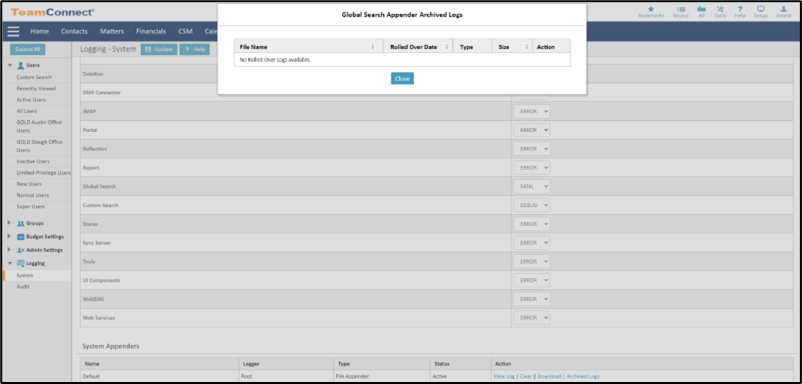
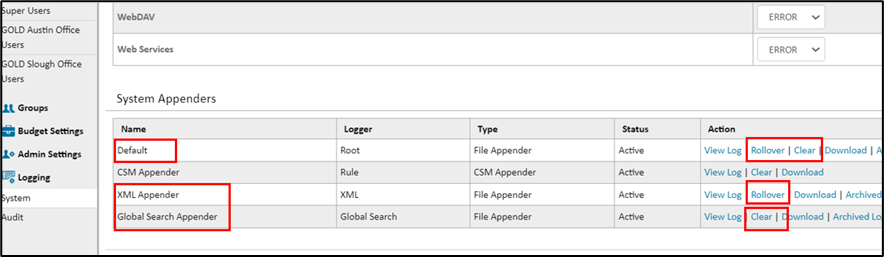
The user can access rolled-over logs from the TeamConnect user interface. There will be a 'Archived Logs' hyperlink for each System Appender. On clicking this hyperlink, a modal will appear with the last 14 rolled-over archived logs based on the last modified date.
Note: Make sure that the user has login with the user account that has group rights equivalent to TeamConnect Admin group.
Below are the steps to follow for System and Audit Appenders:
| Steps to follow | Screenshots for reference |
|---|---|
|
 |
|
Note:
|
 |
Note: The user still has access to the legacy data, as previous old logs will be present in the app server's log section. |
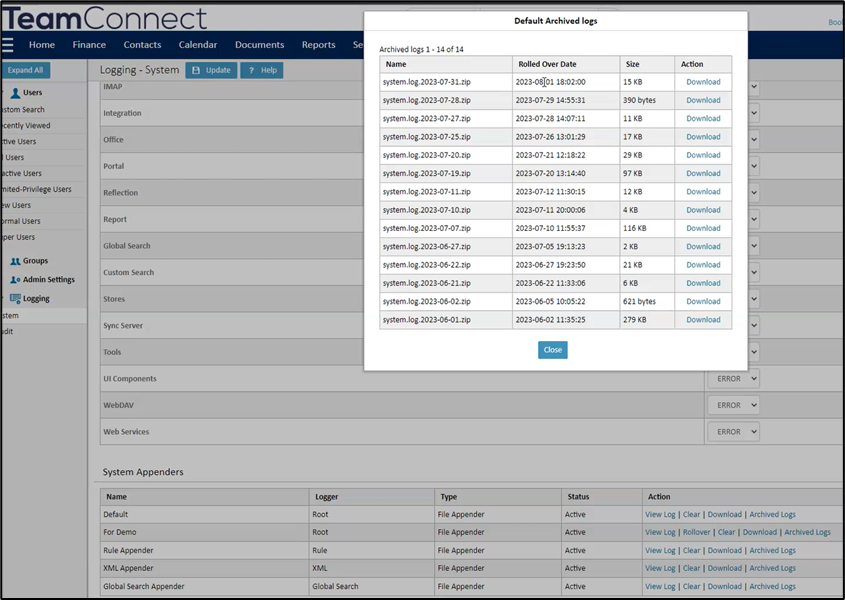 |
Note: If there are no rolled over logs, there will be no records in the table. |
 |
 |
|
| Note: If an error occurs when the user clicks on the ‘Archived Logs’ hyperlink, an error message appears stating that, “Error- Unable to complete your request due to an unexpected error, please try again after a few minutes.” | 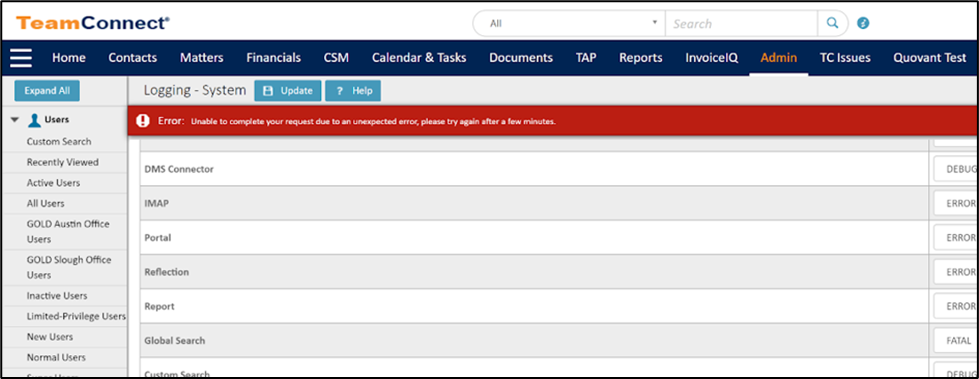 |
|
Note:
|
 |
Modify Log Rollover Policy
Note: Introduced in TCE 7.1 version.
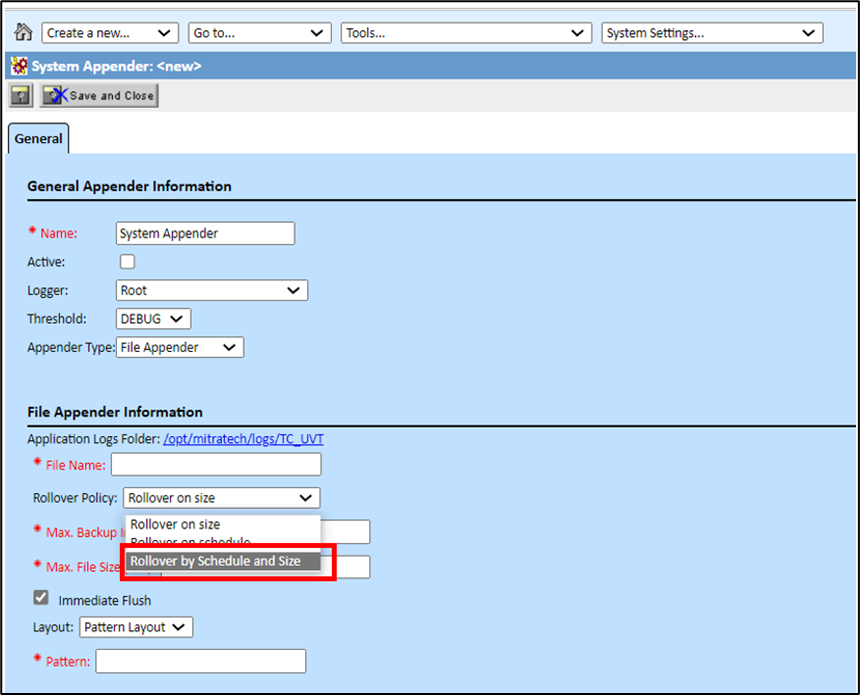
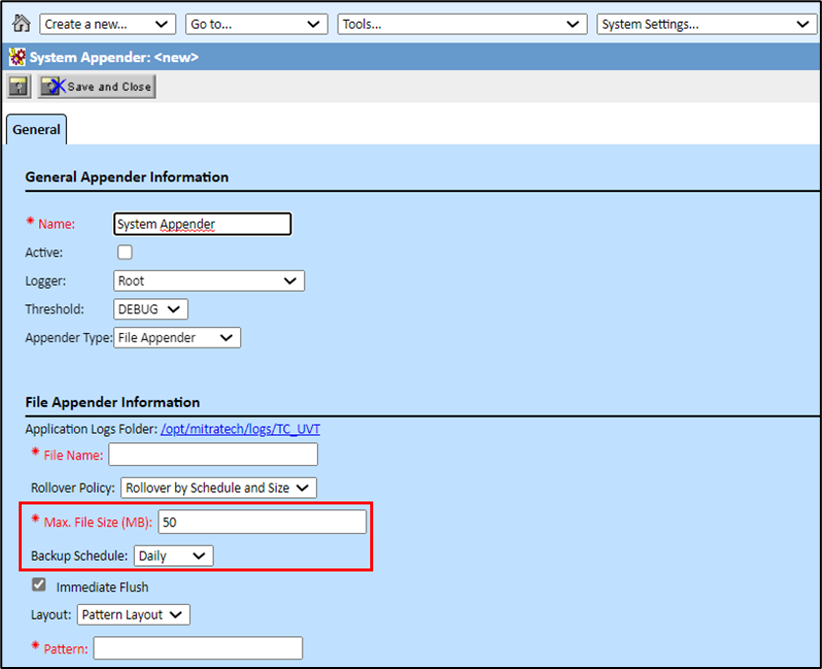
Introduced a new rollover policy called “Rollover by Schedule & Size” where the user will be able to manage logs based on ‘schedule and size’ for efficient log management in Setup window.
Below are the steps to follow for System Appenders:
| Steps to follow | Screenshots for reference |
|---|---|
|
 |
Note: The user can enable the “Roll Over” and “Clear Log” options in the File appender type in the Setup window while choosing “Roll over by size & schedule”, so that they can perform the required actions. |
 |
|
 |
|
 |
Note: In case of existing appender, when the user selects the Pattern Layout, the corresponding “Pattern text field” has existing values that are present for the “Rollover by Schedule” & “Rollover by Size” policies. |
 |
|
Note:
/ ! @ # $ % ^ & ( ) + _ - = { } [ ] | : ' “ , ? ` ~; ' “ , ? |
 |
|
 |
|
 |
|
 |
|
Note: The same above steps can be followed for the Audit Appenders:
|
 |
Configuring Appenders
File Appenders
File appenders define logs that capture messages in a text file as they are generated by the system. The log file is stored in the location that was specified when TeamConnect was installed.
Whether you are defining a file appender for system logging or audit logging, the settings that are specific to file appenders are the same.
For general instructions on defining appenders, see one of the following sections:
- For system logging, see Defining System Appenders.
- For audit logging, see Defining Audit Appenders.

The following table describes the file appender settings.
File Appender Information
| Field or Button | Description |
|---|---|
|
Application Logs Folder |
Indicates the location of the log files on the application server as a hyperlink. This location is specified when TeamConnect is first installed. Note: You can click the hyperlink to view the contents of the folder if you are using the same machine where TeamConnect is installed. Otherwise, navigate to the folder on the application server. |
|
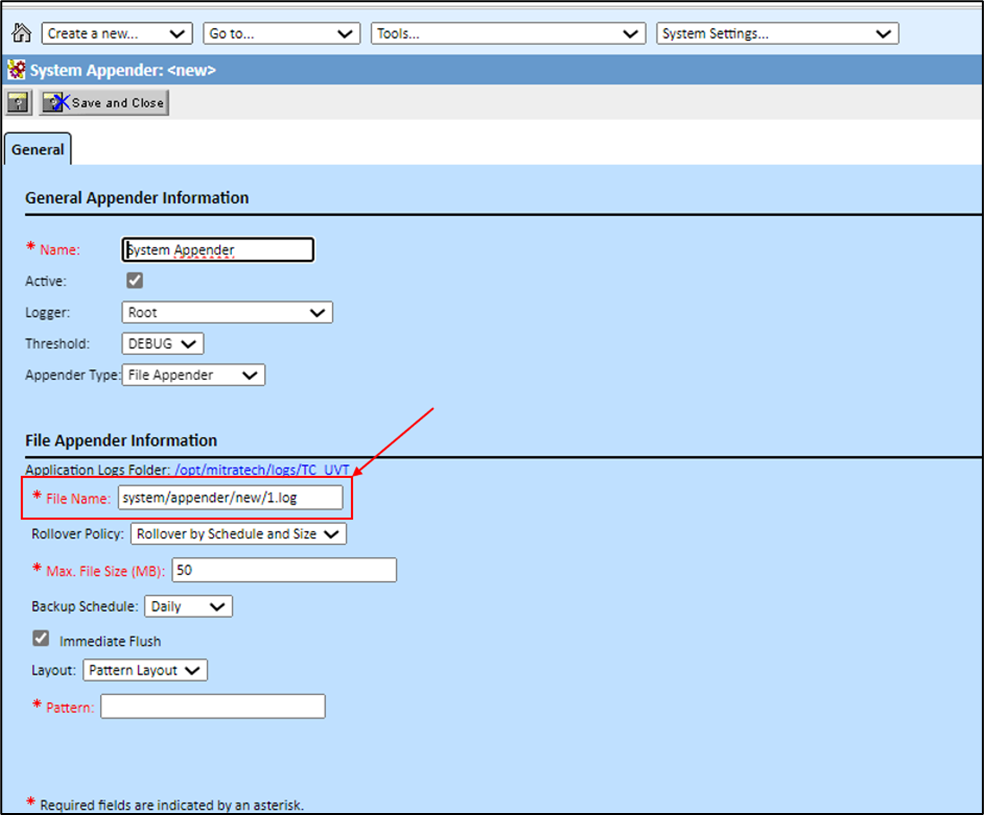
File Name |
Type the name that you want to use as the name of the log file, including its file extension. If you are using HTML or XML layout for the log file, use the corresponding extension. If you want to specify a subdirectory of the logs folder on the application server, you can type the directory location in this field, relative to the logs folder indicated in the Application Logs Folder field. For example, if you want the RulesLog.log file to be stored in a subdirectory called Custom_Rule_Logging, then you would type Custom_Rule_Logging\RulesLog.log as the file name. Important: To organize your log files, you must manually create the corresponding subdirectories directly on the application server. |
| Rollover Policy |
Determines when you want the system to stop writing to a file, add a timestamp to the file name, and begin writing to a new file. Select one of the following:
|
|
Max. Backup Index |
The maximum number of backup files to be stored before backup files are replaced by new files. The oldest file is replaced each time a new file is rolled over. By default, the maximum backup index is 5. Important: Specifying a larger number, such as 10, may negatively impact performance. This field is only displayed if Rollover on Size is selected as the rollover policy. |
|
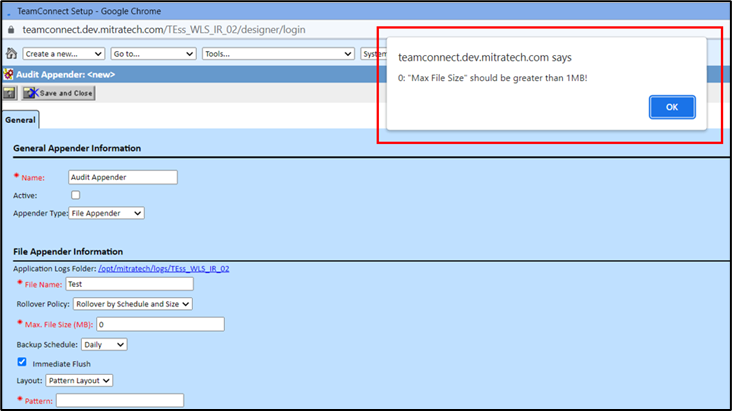
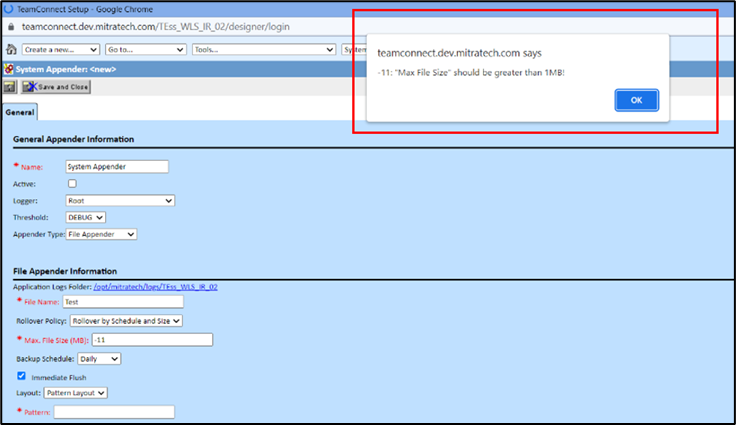
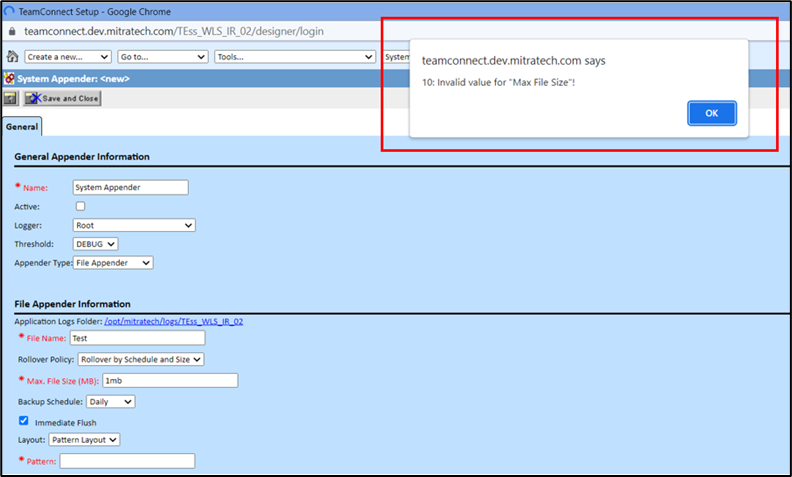
Max. File Size (MB) |
The maximum file size, in megabytes, that the log file should reach before rolling over and starting a new file. By default, the maximum file size is 10 MB. This field is only displayed if Rollover on Size is selected as the rollover policy. |
|
Backup Schedule |
Select how often the log file should be rolled over and timestamped and a new file should be created—Daily, Weekly, or Monthly. This field is only displayed if Rollover on Schedule is selected for the rollover policy. |
|
Immediate Flush |
Select this check-box to have each write of a logging event followed by a flush operation. This helps prevent all or part of a log message from being lost should the application exit abruptly. This check-box is selected by default. If this check-box is not selected, logging throughput is improved by about 15%, but it is more likely that if the application exits abruptly, a logging message that was written might not be completely captured in the log. |
|
Layout |
Select whether you want to use a Pattern, HTML, or XML layout for the contents being written to the log file. Pattern Layout is selected by default. For more details, see File Appender Layouts. |
|
Pattern |
This field becomes available when Pattern Layout is selected in the Layout field. Type the pattern you want to use to display the logging messages in the log file. For more details, see Pattern Layout. |
File Appender Layouts
When you define a file appender, you must specify how you want the contents of the file to be organized and formatted. Log4j® provides several types of layouts for file appenders, including Pattern, HTML, and XML layouts. Each of these layouts has the following advantages and disadvantages:
Comparison of File Appender Layouts
| Layout | Advantages | Disadvantages |
|---|---|---|
|
Provides easy control over content and organization of log file |
|
|
|
|
|
|
Easiest output to parse for specific information using other software |
|
Pattern Layout
The pattern layout is a flexible layout approach for file appenders. You specify what information you want to include in the log file by providing a string of characters in the Pattern field of a file appender. These instructions are interpreted by the system, so that the resulting log file contains the information you need.
The pattern for a file appender is constructed using conversion specifiers and static characters you might want to include, as demonstrated in the Pattern Example.
Pattern Layout Conversion Specifiers
Conversion specifiers indicate what information to write to the log. The following table describes all possible conversion specifiers for pattern layouts.
Log4j® Pattern Layout Conversion Specifiers
| Conversion specifier | Output in log file |
|---|---|
|
%c |
The name of the logger with which the logging event is associated. If desired, you can specify the desired number of right-most components of the logger name to be printed in the log by following the %c with a precision specifier (a decimal constant within braces). By default, the logger name is printed in full. For an example of how the Default system log uses a precision specifier with this conversion specifier, see Pattern Example. |
|
%C |
The fully qualified class name of the calling object issuing the logging request. If desired, you can specify the desired number of right-most components of the class name to be printed in the log by following the %C with a precision specifier (a decimal constant within braces). See Pattern Example for an example of how the Default system log uses a precision specifier with this conversion specifier. Caution: Generating this information for a log is extremely slow. |
|
%d |
The date of the logging event. If desired, you can follow the %d with a date format specifier within braces. For example, %d{HH:mm:ss,SSS} and %d{dd MMM yyyy HH:mm:ss} are acceptable. By default, ISO8601 format is used. Log4j® has its own date formatters. These can be specified using one of the following:
See the Pattern Example for an example of how the Default system log uses a date format specifier with this conversion specifier. |
|
%F |
The file name where the logging request was issued. Caution: Generating this information for the log is extremely slow. |
|
%l |
The location information of the calling object which generated the logging event. Location information includes the file name where the logging request was issued, the line number in the file, the class name, and the method name from which the message was logged. Caution: Generating this information for the log is extremely slow. |
|
%L |
The line number of the file where the logging request was issued. Caution: Generating this information for the log is extremely slow. |
|
%m |
The message associated with the logging event. |
|
%M |
The method name where the logging request was issued. Caution: Generating this information for the log is extremely slow. |
|
%n |
The platform-dependent line separator character or characters. |
|
%p |
The level of the logging event. |
|
%r |
The number of milliseconds elapsed from the start of TeamConnect until the creation of the logging event. |
|
%t |
The name of the thread that generated the logging event. |
|
%% |
A single percent sign. |
Pattern Example
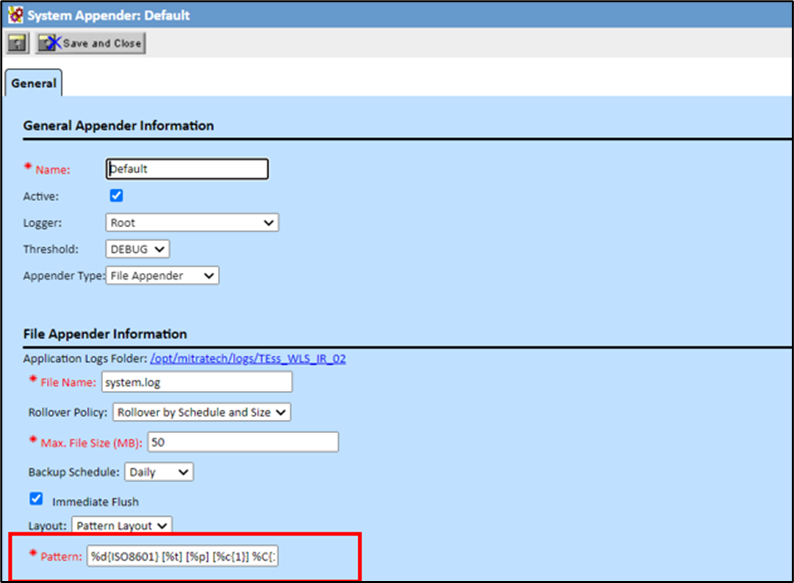
The following pattern shows the use of several conversion specifiers that write information to the log. This is the pattern used by the Default system log:
%d{ABSOLUTE} [%t] [%p] [%c{1}] %C{1}.%M - %m%n
This can be roughly translated as the following:
date [thread that generated the logging event] [level of the logging event] [logger of the logging event] class.method - message followed by a line return
For example, an entry in the Default system log might be:
11:20:44,005 [jessica] [DEBUG] [sql] TCLog$SQLLogWriter.write - UnitOfWork(2420720)
—end unit of work commit
Notice that the spaces, brackets, hyphen and period in this example are printed in the generated line of text in the log as static text.
HTML Layout
The HTML layout for file appenders writes logging events in a clean-looking table. Each logging event written to the log is added as a row in the table. The columns in this table are described as follows:
File Appender HTML Layout Columns
| Time | Thread | Level | Category | Message |
|---|---|---|---|---|
|
Milliseconds elapsed since the TeamConnect was started until |
Name of the thread that generated the event |
Level of the event |
Logger associated with the event |
Message associated with the event |
The following table is an example of a log file in HTML layout:

XML Layout
The XML layout writes logging events in a fixed format. This layout is implemented without more configuration for TeamConnect. Therefore, it does not generate a completely well-formed XML file. It is designed to be included as an external entity in a separate file to form a correct XML file. This allows you to determine how the logging events should be displayed in the log.
The XML layout can be useful for creating output that can be parsed by other software to create a report of specific information. For example, to create an audit report containing a summary of methods accessed by users, you can more easily parse XML than pattern text or HTML.
The following is an example output of a logging event in XML layout:
<log4j:event logger="syslog.basic.sql" timestamp="1063916251658" level="DEBUG" thread="ExecuteThread: '10' for queue: 'default'">
<log4j:message><![CDATA[ServerSession(4688271)--client acquired
]]></log4j:message>
</log4j:event>
SMTP Appenders
TeamConnect's SMTP appender collects the logger messages in a buffer with a specified size. When the buffer receives a message with a severity of Error or higher, the SMTP appender sends an email message with the log events currently in the buffer to the specified email addresses.
To display the SMTP Appender Information
-
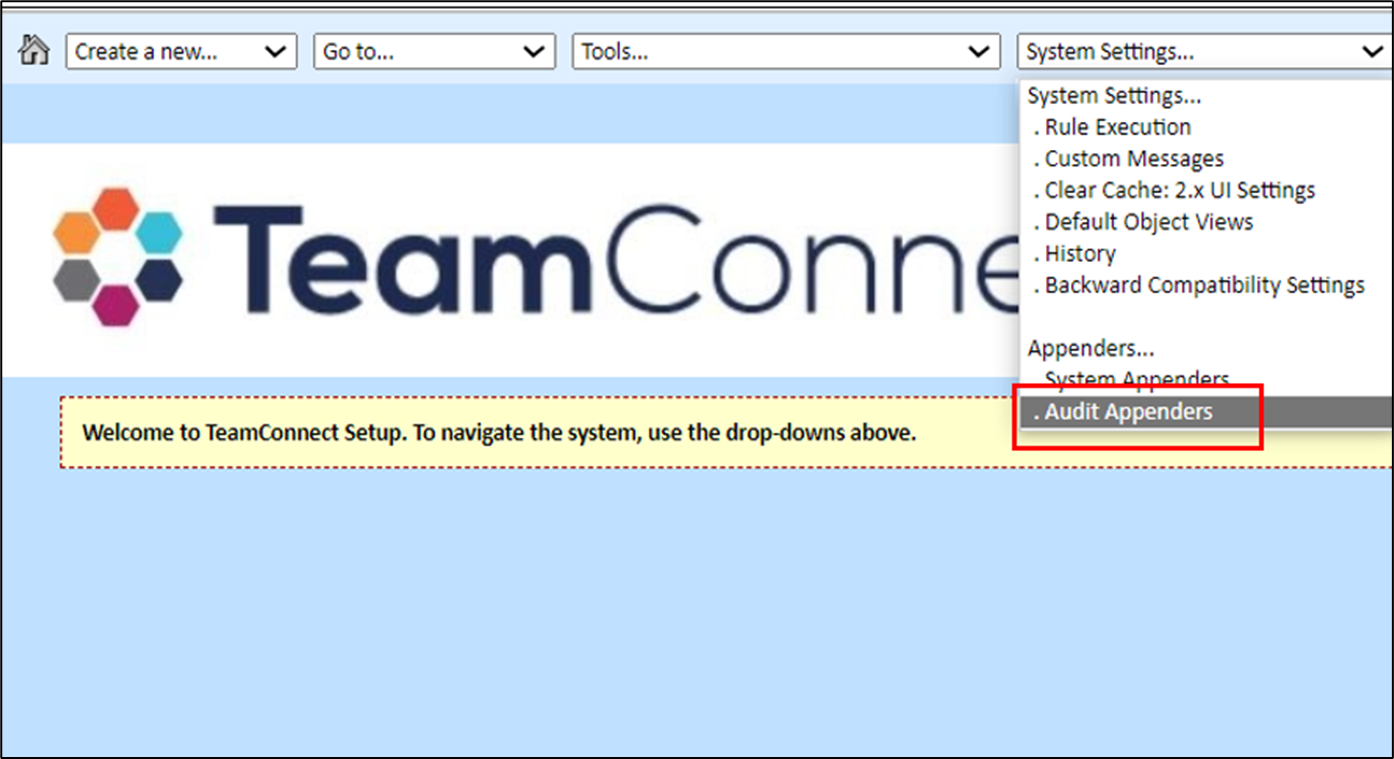
On the Admin menu in the System Settings drop-down list, select System Logging or Audit Logging, depending on which type of logging you need to define.
- In the System Appenders section, click New.
A new appender screen opens. - Select SMTP Appender from the Appender Type drop-down list.
The SMTP Appender Information section is displayed.
For information on how to define appenders, see Defining System Appenders or Defining Audit Appenders. Whether you are defining an SMTP appender for system or audit logging, the SMTP appender settings are the same. The following image shows a set of sample settings:

In addition to the fields described in the following table, you must configure the Outgoing Mail Server Settings section of the Email page under Admin Settings. For more details, see the Admin Settings, Email Page Field Descriptions table.
SMTP Appender Information
| Field | Description |
|---|---|
|
To |
The email addresses to which the log should be sent when a triggering log event occurs. Use commas to separate each address. |
|
Buffer Size |
The maximum size, in kilobytes, of the buffer that collects logging events. When the maximum buffer size is reached, the oldest events are deleted as new events are added to the buffer. The default buffer size is 512 kilobytes. |
|
Evaluator Class |
To specify a log level other than Error (the default) to trigger email messages, you must upload a class that modifies the triggering level. Enter the name of the class file in this field. |
|
Include Location Information |
Select this option to include the location information in the logging events placed in the buffer. For a description of the location information, see the Log4j® Pattern Layout Conversion Specifiers table. If this option is not selected, the location information is replaced with a question mark (?) in the log. However, it can help reduce the generation time of the logging events. |
|
Layout |
Select whether you want to use a Pattern, HTML, or XML layout for the contents being written to the buffer. Pattern Layout is selected by default. The layout functionality is identical to that of the file appender. For more details, see File Appender Layouts. |
|
Pattern |
This field becomes available when Pattern Layout is selected in the Layout field. Type the pattern you want to use to display the logging messages in the log file. For more details, see Pattern Layout. |
Socket Appenders
A socket appender transmits logger messages to a port on a remote host. On the remote host, the messages can then be logged as if generated locally. Using a socket appender allows you to send logs from various systems to a single server where all logs for your organization are monitored or stored.
To use a socket appender, you must define a socket server to receive the log messages. Log4j® includes socket server examples as part of its distribution.
Whether you are defining a socket appender for system logging or audit logging, the settings shown in the following image are the same.

The following table describes the fields in the Socket Appender Information section of the Appender screen.
Socket Appender Information
| Field | Description |
|---|---|
|
Remote Host |
The name or IP address of the server to which the logging events should be sent. |
|
Port |
The port number on the remote host to which the logging events should be sent. |
|
Reconnection Delay |
The number of milliseconds to wait between each failed attempt to connect to the server using the specified port. The default is 30000 milliseconds (30 seconds). If you set this field to zero (0), the socket appender attempts to connect to the server only once. If the connection fails, TeamConnect does not try to reconnect. |
|
Include Location Information |
Select this option to include the location information in the logging events placed in the buffer. Location information includes the file name where the logging request was issued, the line number in the file, the class name, and the method name from which the message was logged. If this option is not selected, then the location information is replaced with a question mark (?) in the log. However, it can help reduce the generation time of the logging events. |
Defining and Managing Appenders
For general instructions on defining all types of appenders, see one of the following:
- For system logging, see Defining System Appenders.
- For audit logging, see Defining Audit Appenders.
Default System and Audit Appenders
By default, TeamConnect has several active file appenders--that is, the logs that they generate are written as text files. These files are stored in the location specified for log folders at the time when TeamConnect was installed. There are three default logging appenders:
- Default (for system logging) — Logs all of the messages that are generated by all of the system loggers and writes them to the system.log file. You can deactivate the Default appender, but it cannot be deleted.
If you want a log that isolates messages for a specific area of TeamConnect, you must define an appender for the corresponding logger.- For instructions on defining a system appender, see Defining System Appenders.
- For a description of the Default system log file, see Pattern Example.
- XML Appender — Logs messages regarding XML requests, according to the level selected for the XML logger, and writes them to the xml.log file.
- Default (for audit logging) — Logs messages from all active audit loggers and writes them to the audit.log file. You can deactivate the Default appender, but it cannot be deleted.
Note: If Collaborati Spend Management is installed on your system, the Collaborati Appender is installed by default.
Defining System Appenders
Although several default system appenders are provided, you can define new system appenders as needed. When you define a system appender, you are defining a log that you want generated for either one specific system logger or for all of the system loggers.
For example, you might want to define a log that only captures messages regarding custom rules that are defined for your implementation of TeamConnect. You can do this by defining an appender for the Rule logger.
Note: For descriptions of the system loggers, see System Loggers.
To define a system appender
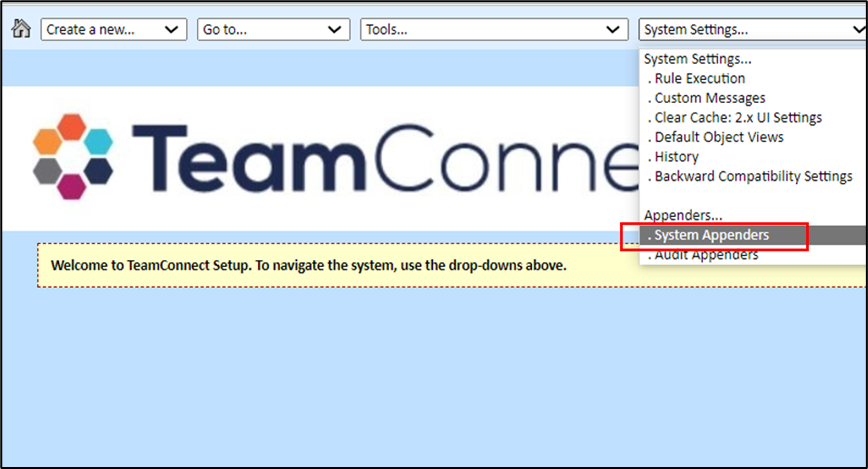
- On the Admin menu in the System Settings drop-down list, select System Logging.
- If the Audit tab is displayed in the Logging screen, select the System tab.
- In the System Appenders section, click New. A new appender screen opens.
- In the General Appender Information section, enter the desired information as described in the General Appender Information for System Logging table.
- Depending on which type of appender you selected in the Appender Type field, enter the desired information in the specific fields for file, SMTP, or socket appenders as described in the corresponding tables:
- Click Save.
- Restart the TeamConnect application on the application server.
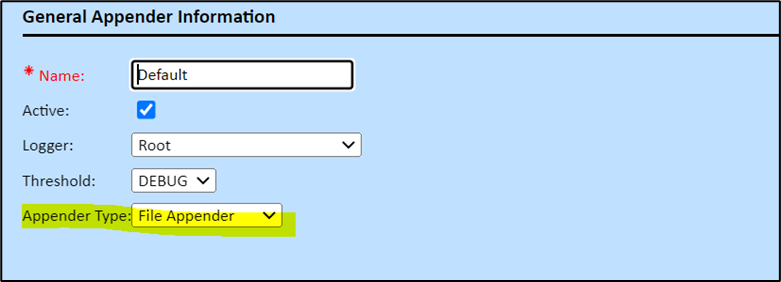
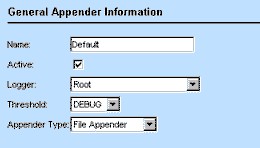
The general information that must be filled out for all system appenders, regardless of their type, is shown in the General Appender Information for System Logging image.
The following table describes the fields in the General Appender Information section:
General Appender Information for System Logging
| Field | Description |
|---|---|
|
Name |
The name of the system appender as you want it to be identified in the list of system appenders in the System Logging screen. |
|
Active |
Select this check-box to activate the appender. Clear to deactivate the appender. Your change takes effect the next time the TeamConnect application is restarted. |
|
Logger |
Select whether you want the system appender to be defined for all loggers or one specific logger. The appender logs all messages associated with the logger you select. If you want the appender to be defined for all loggers, select Root. For more details about the system loggers, see System Loggers. |
|
Threshold |
Select the threshold for the system appender. Allows you to limit the severity of messages to be captured in a particular log. The threshold is appender-specific, whereas the logger levels themselves are system-wide. For example, if you want a certain log to capture only Error and Fatal messages, but you want another log to capture all levels of messages, you can define an appender with the threshold set to Error, even though the logger level itself is set to Debug. |
|
Appender Type |
Select the type of appender you want to define. For details about each appender type, see the following: |
Defining Audit Appenders
Appenders for audit logging differ from system appenders in the following ways:
- Because you do not have to set the levels of the audit loggers, your audit log appender does not need a threshold for which levels to log.
- You cannot define an appender for a single audit logger. Messages from all audit loggers that are turned on are logged in an audit appender.
For descriptions of the audit loggers, see Audit Loggers.
To define an audit appender
- On the Admin menu in the System Settings drop-down list, select Audit Logging.
- If the System tab is displayed in the Logging screen, select the Audit tab.
- In the Audit Appenders section, click New. A new appender screen is displayed.

- In the General Appender Information section, enter the desired information as described in the General Appender Information for Audit Logging table.
- Depending on which type of appender you selected in the Appender Type field, enter the desired information in the specific fields for file, SMTP, or socket appenders as described in the corresponding table:
- Click Save.
- Restart the TeamConnect application on the application server.
After you restart TeamConnect, messages are written to the log that you defined.
The following table describes the general appender information that must be filled out for all audit appenders, regardless of their type.
General Appender Information for Audit Logging
| Field | Description |
|---|---|
|
Name |
The name of the audit appender as you want it to be identified in the list of audit appenders in the Audit Logging screen. |
|
Active |
Select this check-box to activate the appender. Clear to deactivate the appender. Your change takes effect the next time the TeamConnect application is restarted. |
|
Appender Type |
Select the type of appender you want to define. For details about each appender type, see the following: |
Loggers and Logging Levels
Loggers categorize the messages that can be captured in a log according to the area of TeamConnect where that message is generated. Loggers are predefined according to area. You cannot create new loggers.
When you need to log messages from a certain area of TeamConnect, you define an appender for the logger that is associated with that area. For example, you can create a log for the portal panes area by defining an appender for the Portal logger. You can define a log for the user interface components by defining an appender for the UI Components logger.
This section includes the following topics:
System Loggers
System loggers categorize messages in the code according to the area of TeamConnect that generates them, so that you can specify which area's messages you want to capture in a particular log. You can define multiple logs that capture messages from different TeamConnect components or all TeamConnect components.
For each log that you have defined, you can specify an overall threshold for what severity of messages you want written to it, so that the logs contain only the most pertinent information. For more details about the threshold for a log (or appender), see the General Appender Information for System Loggers table.
For each available TeamConnect component, you can specify what severity (level) of messages you want written to the logs regarding this component, so that the logs contain only the most pertinent information about the component.
The loggers that are available for system logging are listed on the System tab of the Logging screen, as shown in the System Loggers and Detailed System Loggers images.
All of the system loggers have Root as their parent logger. This hierarchy allows appenders defined for the Root logger to be available to descendant loggers. For example, this means that the Default appender, which has been defined for the Root logger, receives logging statements from all of the loggers in the hierarchy.
Tip: Because the Default appender captures messages from all loggers in the system, you do not need to define another appender for the Root logger.
You can define an appender to be the target of a single logger in the hierarchy. This appender only receives logging statements from the logger for which it is defined. For example, if you need a text file that logs events for the batch display component, you define an appender for the Batch Display Component logger.
The following image shows the System Loggers section of the Logging screen:

The following table describes the System Loggers section:
System Loggers Table
| Logger | Description |
|---|---|
| Request | Logs HTTP request information including headers, cookies, and parameters. This logger can automatically be set to the Debug level each time TeamConnect application is restarted. This depends on the value of the syslog.basic.request parameter in the Web Application Deployment Descriptor. |
| Response | Logs HTTP response header information. |
| SQL | Logs TopLink-generated SQL statements. This logger can automatically be set to the Debug level each time TeamConnect application is restarted. This depends on the value of the syslog.basic.sql parameter in the Web Application Deployment Descriptor. |
| Rule | Logs messages generated by rules that have been defined for your implementation of TeamConnect. |
| XML | Logs messages regarding XML requests. |
Detailed System Loggers
The following image shows the Detailed System Loggers section of the Logging screen:

The following table describes the Detailed System Loggers section:
Detailed System Loggers Table
| Logger | Description |
|---|---|
| Authentication | Logs all messages regarding user authentication. |
| Batch Display Component | Logs all messages regarding the batch display component. |
| Custom Blocks | Logs all messages regarding custom blocks. |
| Deletion | Logs all messages regarding record deletion. |
| DMS Connector | Logs synchronization, configuration, and document activity with external Document Management Systems (DMS). |
| IMAP | Logs events related to the TeamConnect IMAP Server and Email Viewer. |
| Integration | Logs all events and errors related to TeamConnect’s interactions with external systems and APIs, such as TAP, document management systems (DMS), and third-party integrations, through the Integration logger. |
| Office | Logs all errors and activities related to Office endpoints and integrations such as Office API calls and future Graph API features in TeamConnect, helping administrators monitor and troubleshoot Office-related functionality through the Office logger. |
| Portal | Logs all messages regarding portal panes, including custom content. |
| Reflection | Logs all messages generated by TeamConnect's reflection factory. |
| Report | Logs execution, data retrieval, and rendering messages for both legacy and TCBI reports. |
| Global Search | Logs all messages regarding Elasticsearch views, searches, and indexing, including information sent from TeamConnect to Elasticsearch as well as information from inside Elasticsearch itself. Due to the large amount of data stored in this log, it is only intended to be used for short periods of time. (This log is available starting in TeamConnect 6.1. |
| Custom Search | Logs all messages regarding Custom Search views and searching for records. |
| Stores | Logs all messages regarding TeamConnect stores. |
| Sync Server | Logs all messages regarding cache synchronization. |
| Tools | Logs all messages regarding both system and custom tools. |
| UI Components | Logs all messages regarding rendering of TeamConnect screens. |
| WebDAV | Logs all messages related to WebDAV document management. |
| Web Services | Logs incoming and outgoing API and web service calls, including headers, parameters, and responses. |
Audit Loggers
Audit loggers send their messages to logs defined by audit appenders. Unlike system loggers, audit loggers have the following characteristics:
- Audit loggers are turned on or off system-wide. You do not have to set levels for audit loggers.
- When you define an appender for audit logging, all audit loggers that are turned on send their messages to the log. You cannot define separate logs for the various audit loggers.
- When you define an appender for audit logging, you do not have to specify a threshold. For details about defining audit appenders, see Defining Audit Appenders.
The following image shows the available audit loggers.

The following table describes the Audit Loggers section:
Audit Loggers Table
| Logger | Description |
|---|---|
| API Read | Turn on this logger to log read calls to the API. |
| API Update | Turn on this logger to log update calls to the API. |
| Page Open | Turn on this logger to log the opening of a page by a user. |
| Login/ Sign Off | Turn on this logger to log user sign on/off events. |
| Export/ Download | Turn on this logger to log PDF exports or downloads from users. |
| Digest Email | Turn on this logger to record Digest Email activity, including start/end time and per-user email delivery status. |
| Log Level | Turn on this logger to log every change made to system logging levels for audit tracking. |
Turning Audit Loggers On or Off
To turn audit loggers on or off
- Click the Admin tab.
- Click the Logging link under the tab bar.
- Click the Audit link from the left pane.
The Audit Logging page opens. - From the Audit Loggers section, locate the name of the log you want to turn on and select On from the drop-down list.
- Locate the name of the log you want to turn off and select Off from the drop-down list.
Enhanced Auditing for System Log Level Changes
Note: Introduced in TCE 8.0 version.
TeamConnect now introduces the new Log Level Audit logger that automatically records all changes to system logger severity levels, to improve compliance and simplify troubleshooting.
How It Works: When an administrator modifies a logger’s severity (e.g., from ERROR to DEBUG) on the Admin → Logging page, a detailed audit event is generated. This entry captures who made the change, the old and new severity levels, and the exact time of the modification, providing a complete and auditable history.
Note: The Log Level Audit logger is enabled by default for all new and upgraded TeamConnect versions. You can manage this setting from the Admin → Logging → Audit Loggers screen, as shown here.

The resulting audit entries are written to all active Audit Appenders and will display the details of the change clearly, as shown here:

Introducing Logging Level Timeout for System Loggers
Note: Introduced in TCE 8.0 version.
Description: TeamConnect now supports the ability for administrators to temporarily increase the detail level of system loggers to DEBUG, INFO, or WARN for a configurable duration ranging from 10 minutes to 4 days. This is done directly from the Admin Logging interface and provides a self-service way for support teams to collect rich diagnostic data for troubleshooting without requiring a system restart.
The screenshot below illustrates how the “Timer (minutes)” dropdown appears after selecting DEBUG, INFO, or WARN in the Level column, allowing you to choose a specific duration for the override.

The logger’s level will automatically revert to its previous state after the selected time expires, preventing verbose logging from being left on accidentally in production environments.
Important Note: If you see the message “Will change back to ERROR within the next minute” after the selected timer expires, refresh your browser page to see the update.
Alternatively, the feature can be disabled globally via the “Disable Logging Level Timeout” checkbox, located under System Settings → Backward Compatibility Settings, as shown below.

Note: For enhanced security and tracking, this feature is fully integrated with the Log Level Audit logger. All related actions - such as who set the timed override, the new level, the timer’s duration, and the automatic reversion event - are recorded in the audit logs.
An example of how these events appear in the audit log is shown below:

Advanced Logging Features
New CSM logger and Integration Logger
Note: Introduced in TCE 7.1 version.
Earlier versions of TeamConnect (TCE 7.0 and older versions), CSM logs were added to the rule logger, creating a lot of disturbance and making it hard to locate and troubleshoot rule errors.
In TCE 7.1 version, the user can configure the CSM log separately from the Rule logger or any other logger so that they can debug rules/other logger issues without CSM filling in the noise.
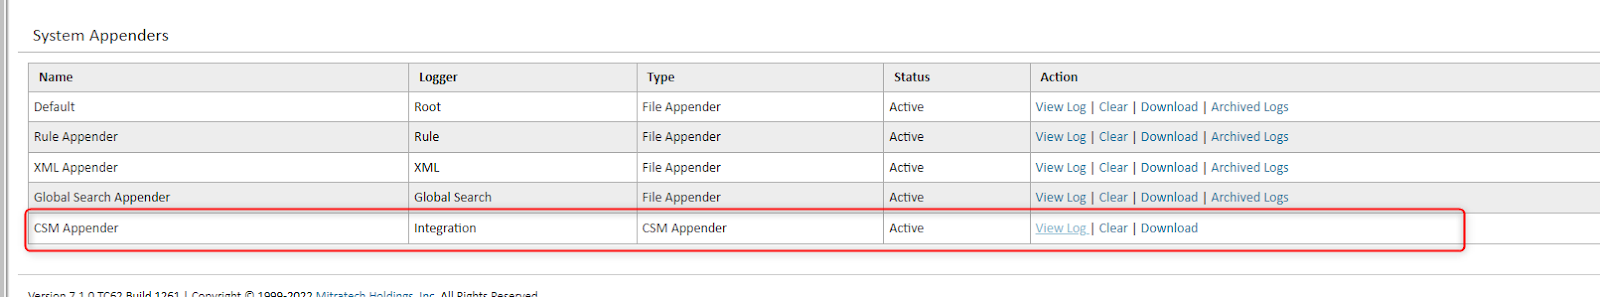
- Now, there is a separate CSM appender which is linked to a new Integration Logger in order to better organize and therefore troubleshoot various errors.
- The user will be able to debug issues related to rules by setting Rule Logger to DEBUG without any CSM logging in the log file.
- The user can see that there is a new log controller for any integrations called Integration Logger under Detailed Systems Logger.
Note: Integration Logger is consistent with TeamConnect log levels Ex: (Error, Debug, Info, Warn).
- The CSM Logging is also routed to the newly created “Integration Logger”.
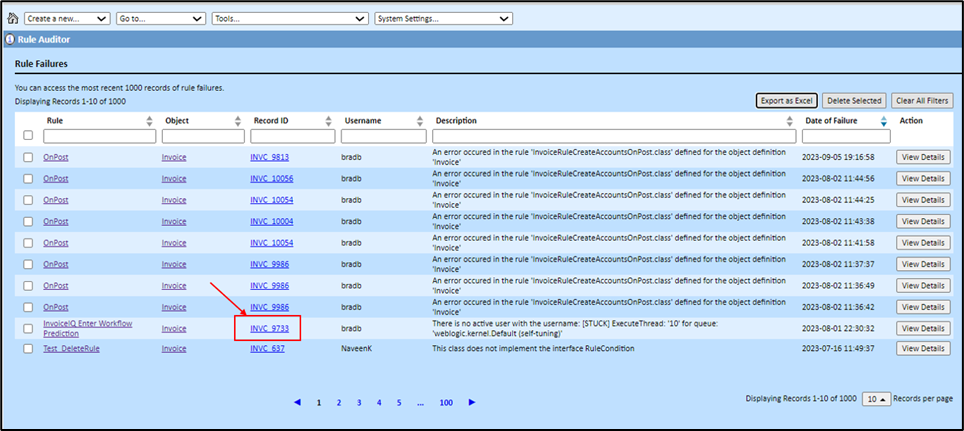
Rule Auditor
Note: Introduced in TCE 7.1 version.
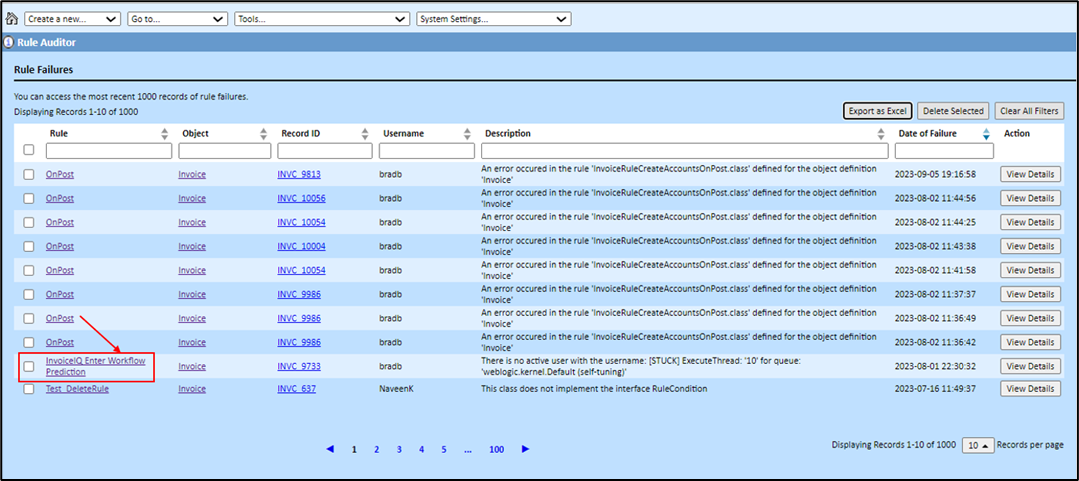
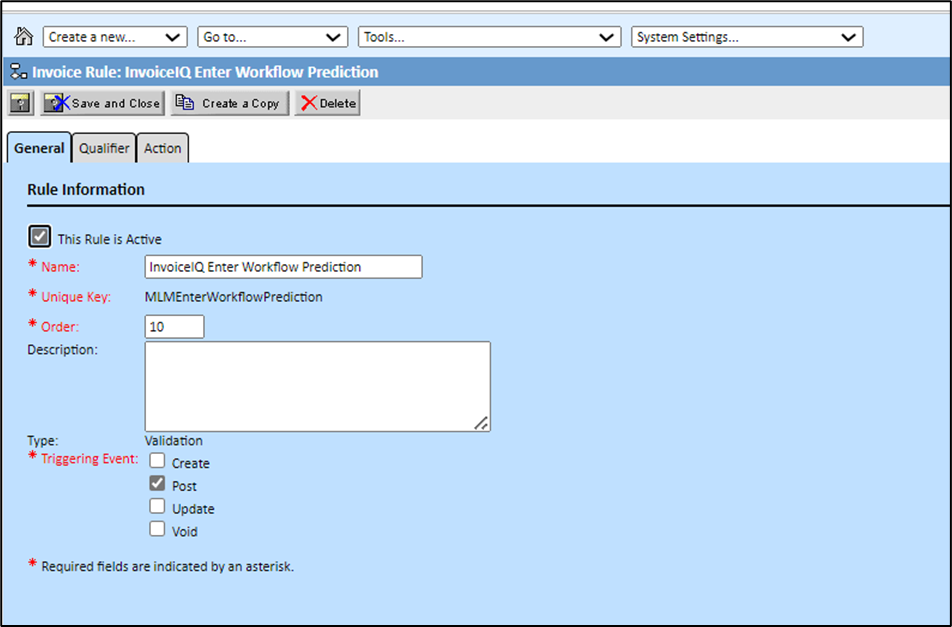
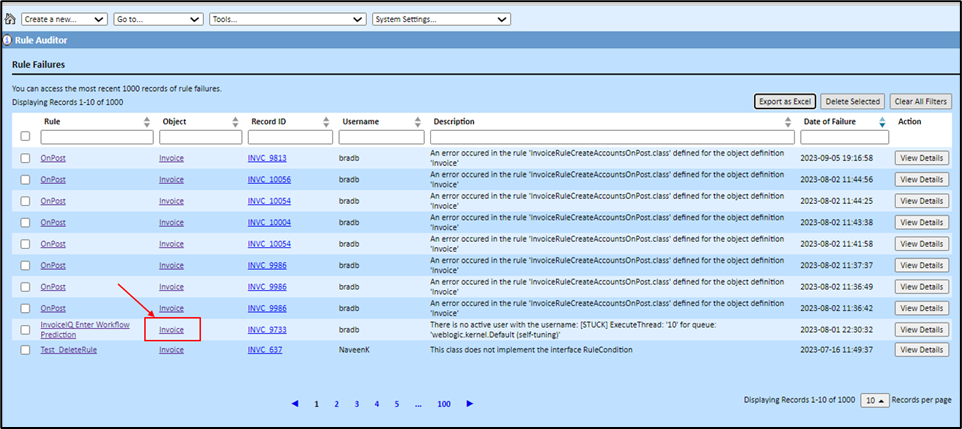
The user can view the list of rule failures which occurred as part of rule execution in the Rule Auditor table to diagnose and troubleshoot issues related to rule failures. These rules must be part of the object, and if the condition fails, whether as part of the action or as part of the qualifier, it will be triggered, and the rule will be captured.
Note:
-
Runtime failures (critical exceptions) thrown from Action or Qualifier code flow directly into the Rule Auditor. Administrators can filter, sort, and export those entries via the UI, without needing to dig through log files.
-
Intended validation errors (for example, explicit “deny/validate” logic) still surface to end users via the UI, but do not appear in the Rule Auditor, so they won’t clutter the list.
-
If you expect a failure but see nothing in Rule Auditor, check the standard rule logger via System Logging. It may be either TCException thrown from an Action class or a TCKeyedApplicationException from a Qualifier.
-
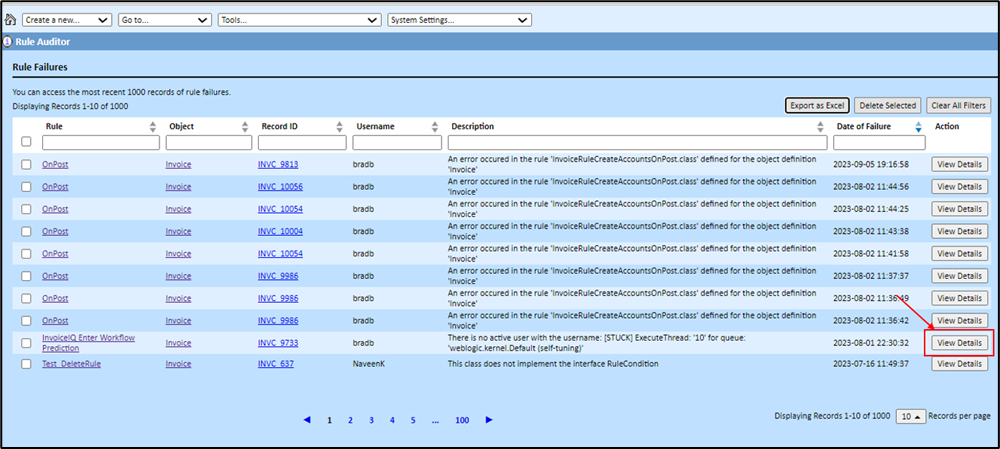
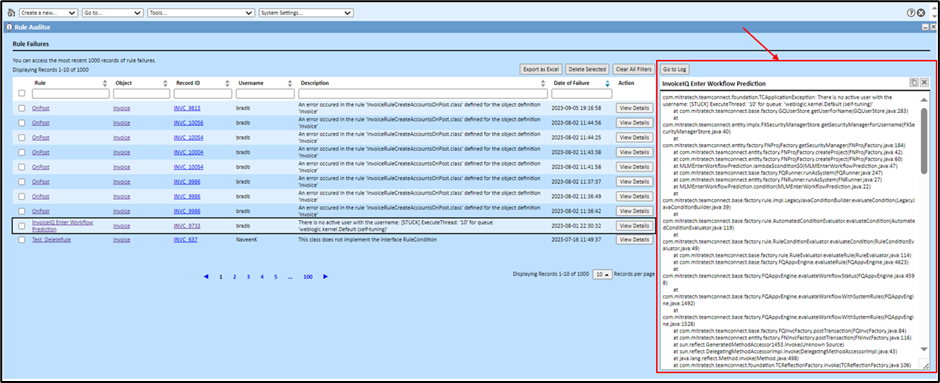
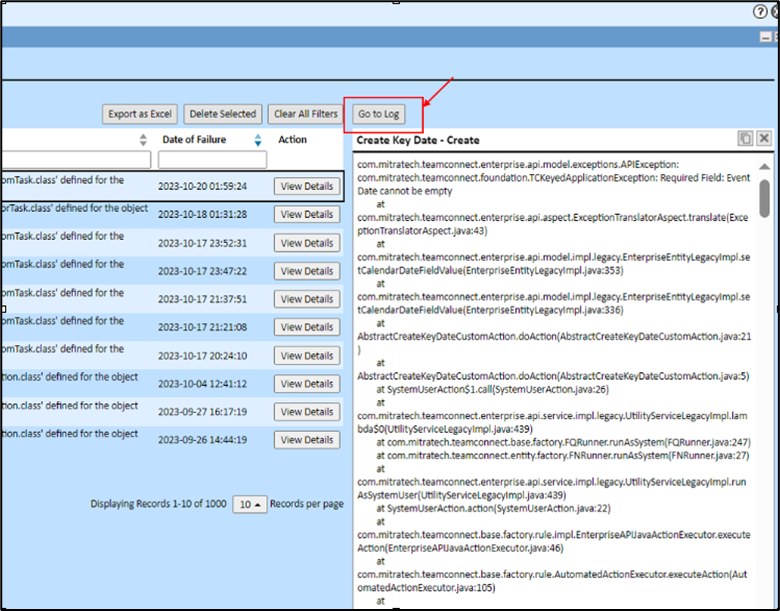
From a Rule Auditor entry, you can click built-in hyperlinks to navigate to the failing rule, object definition, or record. Use View Details to copy the full stack trace or Go to log to open the underlying log file.

Below are the steps to follow:
| Steps to follow | Screenshots for reference |
|---|---|
|
 |
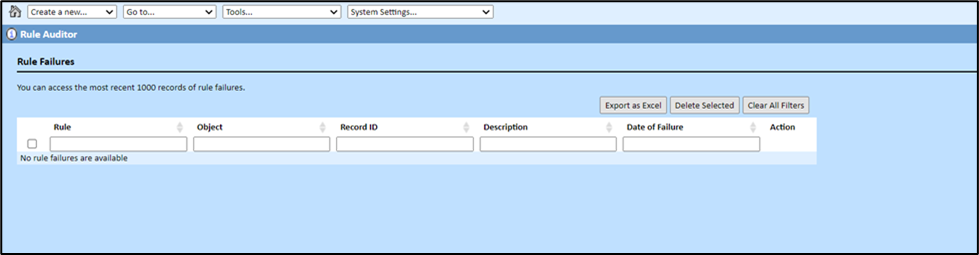
Note: When there are no rule failures, a message is displayed in the table saying, “No rule failures are available". |
 |
|
Below data retrieved is displayed as shown below:
|
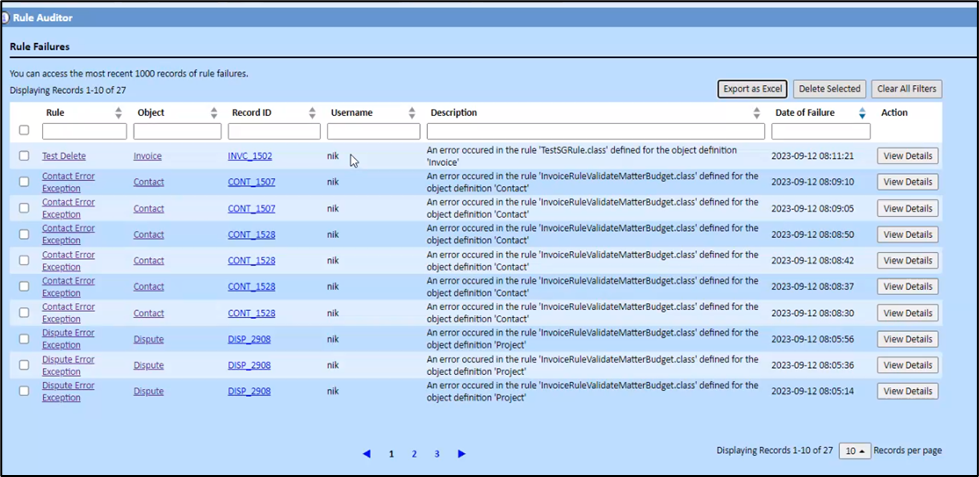 |
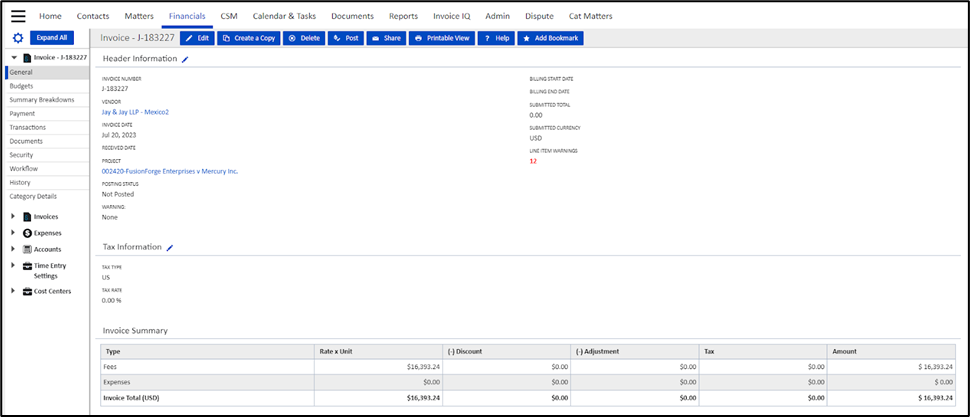
| Note: When the user hover on any rule name or object, the hyperlink appears which makes the text clickable. Also, the RecordID is hyperlinked which when clicked will take the user to a new window where the record is displayed. | 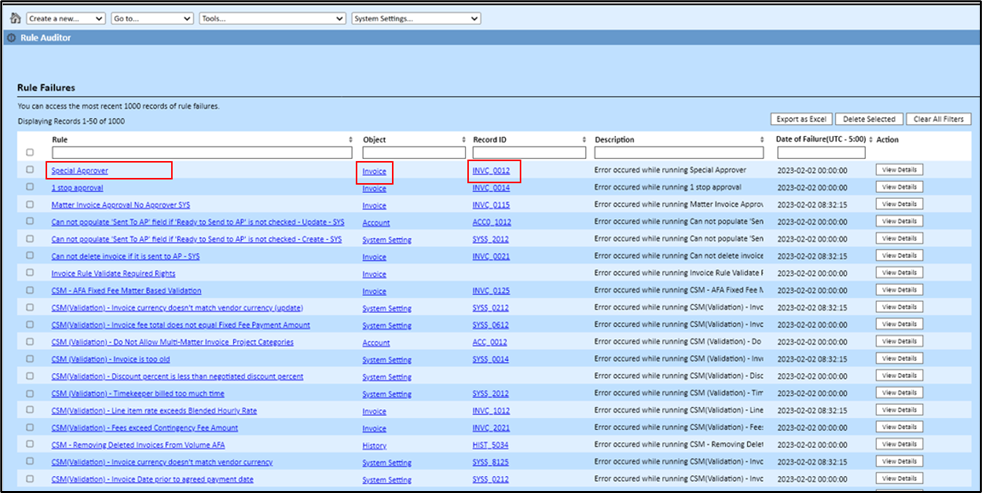 |
|
|
|
|
|
|
|
|
|
|
| Note: The StackTrace Box has an “X” icon (while hovering, the user can see “Close the Error Log”) to close it and a copy icon (while hovering, the user can see “Copy the Error Log”) to save the stacktrace to clipboard (Ctrl+C functionality). | 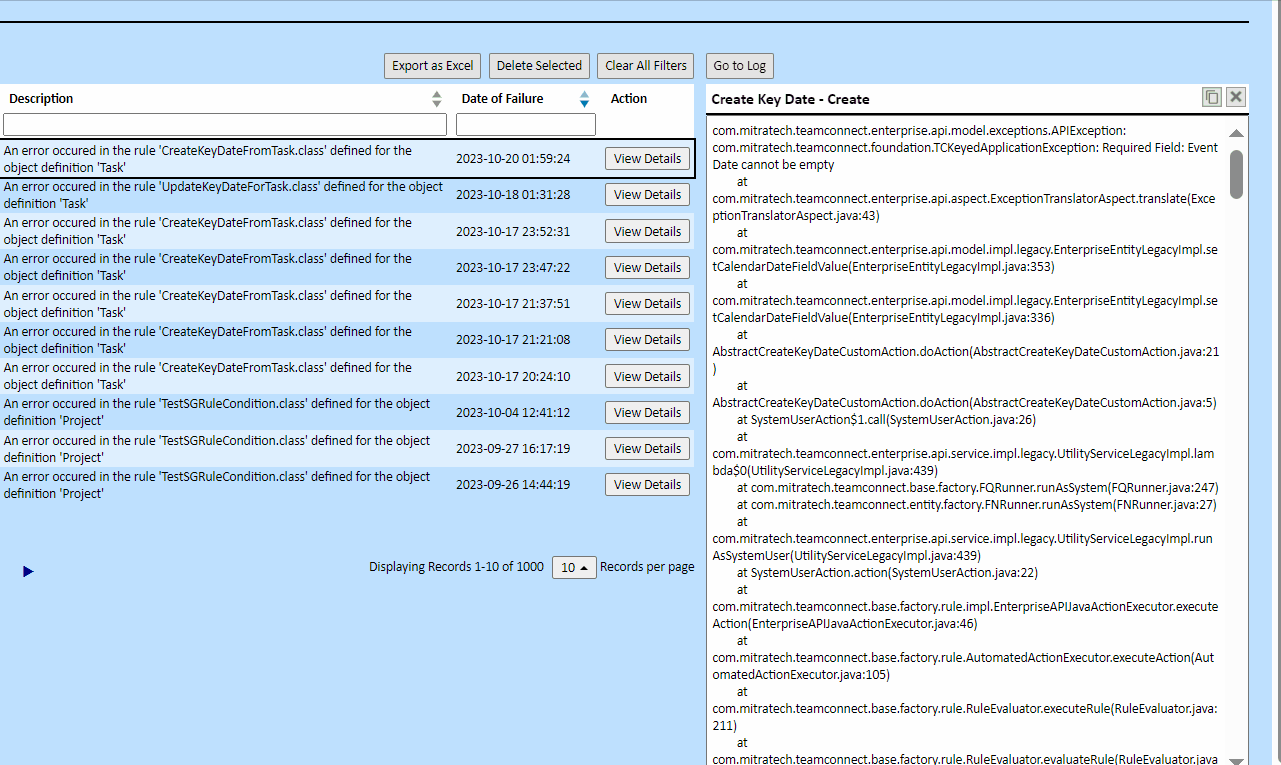 |
Exception logging behavior in Rule Auditor
The following table shows which exceptions are captured by the Rule Auditor and which are logged only in the standard rule logger.
| Where the exception originates | Exception type | Appears in Rule Auditor | Notes |
|---|---|---|---|
| Custom Action - Action class | TCException | No | Logged to the rule logger only. |
| TCKeyedApplicationException | Yes | Captured and listed with the full stack trace. | |
| Any unhandled Java runtime exception (For example: NullPointerException, IllegalStateException) | Yes | Helps quickly diagnose unexpected failures. | |
| Custom Action - Qualifier class | TCException | Yes | Recorded as a rule failure entry. |
| TCKeyedApplicationException | No | Logged to therule logger only. | |
| Any unhandled Java runtime exception | Yes | Same behavior as for Action classes. | |
| Validation rule (qualifier evaluates to True) | TCKeyedException (Intended validation failure) | No | Validation errors stop user processing and appear in the UI, but they aren’t treated as runtime errors, so they bypass the Rule Auditor. |
Export Rule Auditor Data with Stack Traces
TeamConnect now exports the stack trace for each rule failure as a column in the Rule Auditor Excel report. This enhancement streamlines error analysis by providing all necessary technical details in a single file. By including the stack trace directly in the Excel export, you can more efficiently review, filter, and share complete error logs outside of TeamConnect.
For detailed instructions on how to view, filter, or manage rule data, see the Rule Auditor section.
To export rule failure data:
| Steps to follow | Screenshot for reference |
|---|---|
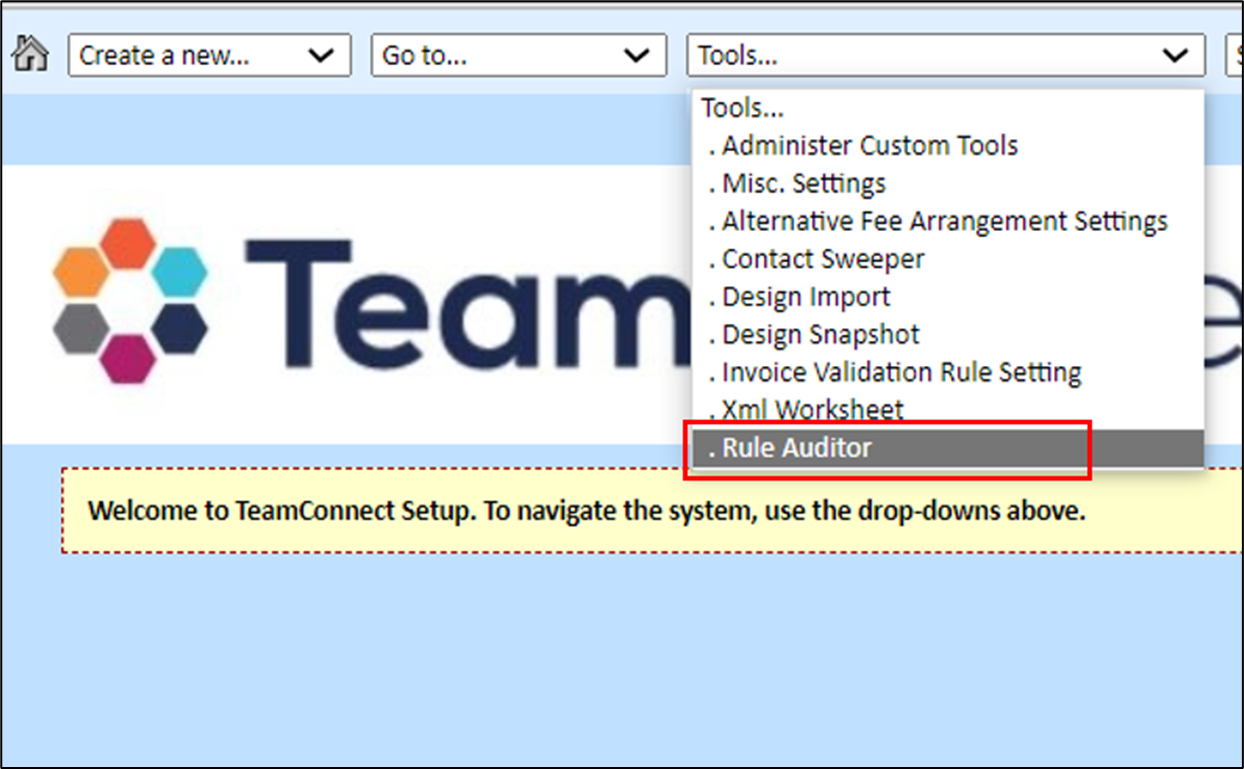
| 1. Navigate to the Rule Auditor page (Setup → Tools… → . Rule Auditor). The Rule Auditor page will be opened. |  |
| 2. Apply any necessary filters to identify specific failures. | |
| 3. Select Export as Excel. The downloaded file will contain the Stack Trace column. |  |
Here is an example of an exported Excel file including the Stack Trace column:

How to paginate and sort or filter any column in rule auditor?
Note: Introduced in TCE 7.1 version.
- The user can sort by any column in ascending or descending order and filter by any column (except the Action Column).
- The user can paginate the entries in the rule auditor table, with a configurable number of Records per Page with a default value of 10.
- A message will be displayed on top of the table that indicates current records displayed out of total records. For example, “Displaying records 1-50 of 100”.

Note:
- Also, one can check the user who triggered the rule so that it can help with troubleshooting the issue when the user is known under the Username column.
- The number of entries in rule auditor is limited to 1000 records. The moment it reaches more than 1000 records, the older records get deleted and the new records get inserted in the database.
How to export rule failures to an excel file?
Note: Introduced in TCE 7.1 version.
The user can export all the entries of the rule failures in the rule auditor to an excel file by clicking the “Export as Excel” button on the top of the RuleFailure table, so that the user can have a snapshot of all failures which can be analyzed. Furthermore, when filters are applied, the export option can be used to export even for the filtered results.

Note: The user can select multiple entries in the Rule Auditor table by clicking on checkboxes in the first column and delete them at once so that they can remove entries that have been resolved or are no longer relevant.

Rule failures saved in the database
Note: Introduced in TCE 7.1 version.
The user can capture and save rule failures in a structured format and easily display in the Rule auditor table.
- Users should make sure that stacktrace that they are capturing has only “Error” log level statements i.e., when checked on the original system log, rule auditor stacktrace should be present with "ERROR" log level in the original system log.
- Failed on timestamp indicates the application server’s timezone.
- The logging will be performed at rule failure state itself, so that relevant stacktrace details are captured.
- The rule failure data is configured so that logged format will be relevant to Rule Auditor user interface columns i.e., Rule name, Object, RecordID, Username, Rule Description, Failed on, and Action.
- Error description content can be clipped off data from stacktrace to the first 140 characters (OR, if using .css to trim the content, then display characters as it fits within the width of the column).