
Tutorial - Reports for View-Only Users
TeamConnect Business Intelligence provides colorful visual reports embedded within TeamConnect. Interactive dashboards provide multiple visualizations of similar data in one screen for easy user consumption and analysis, and users can drill directly into dashboards to report on specific data.
Everything in this tutorial pertains to both Viewer and Designer users.
Types of Users
There are two kinds of users:
- Viewers, who have the following rights:
- Viewing the reporting module
- Viewing reporting dashboards, widgets, or folders for which they have permission and have been shared with them
- Cosmetically interacting with dashboards or widgets
- Downloading files for dashboards and widgets
- Receiving scheduled reports (users who want to get schedule reports must have view-only rights for reporting)
- Modifying any of the dashboard & widget filters that have been made available to them by the owner of the dashboard (these changes are stored locally unless an Owner makes a change, republishes it, and refreshes and the Viewer refreshes as well)
- Designers, who have the following rights in addition to Viewer rights:
- Creating new dashboards and reports (in which case they become the owner of the dashboard)
- Modifying or deleting an existing report
- Duplicating an existing report
- Modifying the orientation/layout/structure of widgets within the dashboard
- Modifying view permissions for dashboards
Owners can modify the report and push updates to other users by republishing the dashboard. All other users viewing/designing the dashboard must refresh on their end as well in order to see the changes the owner has made. An owner can explicitly give other users designer or view-only rights to their dashboard. A user's security permission for reporting is is limited by the type of user he or she is. For example, a view-only user (by system permission) cannot be given designer rights to a dashboard, but a designer user (by system permission) can be assigned as a view only or designer user to a specific dashboard.
Viewing Dashboards
You can view dashboards that were shared with you or, if you are a Designer, that you have created. When a dashboard is shared with you, you may receive an email with a link or you may simply see a new dashboard in the dashboards list on the Reporting Administration page.
Viewing Reports from the Reports Tab
To view a dashboard from the Reports tab:
- Click the Reports tab on the tab bar.
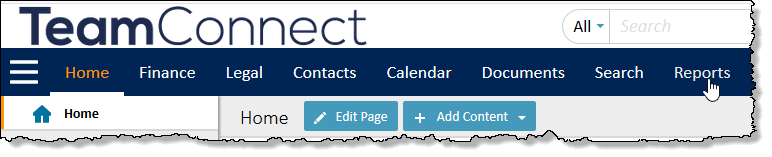
- In the navigation pane, you can see the dashboards and folders to which you have access. To view a dashboard, click its title.
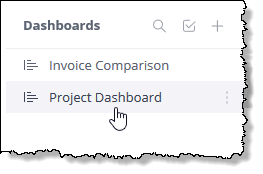
- To search for a dashboard, click the Search icon next to the Dashboards heading in the navigation pane. Results appear in the left pane as you type.
Viewing Reports from the Home Page
You can also view reports from portal panes on your TeamConnect Home page. TeamConnect includes a standard Reports List portal pane that contains a drop-down list of report folders. Choose a folder name from that drop-down to see links to the reports that are contained in the folder. Click a link to execute the report.
Tip: You can set a portal pane to remember a folder name by clicking the Edit icon in the pane's title bar, entering a folder name, and then clicking the Save button. In the future, each time the portal pane is displayed, that folder is automatically selected.
Based on your user group and the home pages defined by your organization, your home page may already contain dashboard portal panes that display specific reports.
For information about dashboards and portal panes, see Home Pages and Portal Panes.
Drilling Down into the Data
Unless disabled by the dashboard’s Designer, you can drill down into your data in most widgets to get an in-depth view of a selected value. To drill down into an item, right-click the item on the chart, select Drill Into, and select the field into which you want to drill down.
Downloading Dashboards into PDF or Image Formats
Dashboards can be downloaded into a PDF or image format. You can use these static report downloads to capture data from a particular moment in time, and these reports can be shared with people without having to log into TeamConnect. Note that your security permissions are applied to the data downloaded to the PDF or images, so use caution when sharing reports with people do not have security rights to view that data.
To download a dashboard:
- Click the Options icon for the appropriate dashboard and click or hover over the Download option. The Options icon is three vertical dots located in the navigation pane to the right of the dashboard name, or in the upper right corner of an open dashboard.
- Select Download PDF or Download Image.

- Select your settings for the PDF or image and click the Download button. The report is converted and downloaded to your computer.
Downloading Widgets
Depending on the widget, widgets can be downloaded or exported into an image, CSV, Excel, or PDF. You can use these static report downloads to capture data from a particular moment in time, and these reports can be shared with people without having to log into TeamConnect. Note that your security permissions are applied to the data downloaded to the PDF or images, so use caution when sharing reports with people do not have security rights to view that data.
To download a widget:
- Click the
 Options icon for the appropriate widget and click or hover over the Download option. The Options icon is three vertical dots located in the navigation pane to the right of the dashboard name, or in the upper right corner of an open dashboard.
 - Select Image, CSV File, PDF File, or Excel File. Note that only the displayed (filtered) data is exported according to the currently selected filters.
- Select your settings for the file and click the Download button. The widget is converted and downloaded to your computer.
Tip: The image size reflects the size of the widget on the screen when you download it. To create a larger image, we recommend enlarging the widget space in the dashboard or opening the widget in edit view to create a larger image.