
TCBI - Widgets
Widgets
This section pertains only to Designer users.
Adding Widgets to a Dashboard
The Widget Wizard automatically guides you through a very simple process of creating a widget, while offering the best recommendations for displaying the data that you select. However, if you want more control over your widget's appearance and behavior, click the Advanced Configuration option in the bottom left of the wizard to access a rich variety of additional design options.
Important: Review this section of documentation regarding enabling/disabling the "drill to anywhere" option before continuing with creating a new widget.
To Add a Widget to the Dashboard:
- If this is your first widget, click the Select Data button.

- In the Data Browser, select one of the fields (columns) from this ElastiCube assigned to the dashboard. If you already have widgets in your dashboard, then click the + Widget button.

- Note: To select data from a different ElastiCube, click From on the right side of the New Widget window and select an ElastiCube.
- Type a title to your widget in the Add Title text box. Choose a descriptive name for your widgets to make them easily identifiable in TeamConnect for portal panes or block embedding.
- In the Data Browser, select a field to add to your widget. The field that you select is automatically displayed in a suggested widget. When only a single numeric field is selected, it is displayed as an Indicator widget. A single descriptive field is displayed as a Pivot widget.
- Select more fields to add more fields to the widget. As you add fields, the relevant options are displayed as buttons to the left of your selection. The fields that you select are listed across the top left of the wizard.
- Click each visualization button to display the selected fields in that visualization.

- When you have finished creating your widget, click Create. The widget is added to the dashboard.
Note:
- The best recommendation for your widget design is normally provided, however, if you want more control, you can click the Advanced Configuration option on the bottom left of the window to provide a rich variety of additional design options.
- Pivot reports can have a maximum of 3 columns and 20 rows and values.
- Because a report is rendered using browser, a report with more than 100 columns will have issues. Best practice is to limit the number of columns.
- By design, the "Account Total Allocated" field pulls budget data from the "Fees" and "Expenses" level. If you budget on a different level, you will see these values return as $0 in your widgets even when you know there is a budget allocated. If you need to build reports on a different level budget; i.e. Vendor level or Matter level, contact Services to run the customized script that will pull "Account Total Allocated" from the correct location.
Tip: When selecting a field, if you cannot find the list values for a field, look in the main table for that field.
Configuring Widgets
Enable/Disable Drill Down Option
Drill to Anywhere is enabled by default on new reports. This means, for example, that if any user clicks on a piece of a pie chart to drill into the data, they may be taken to a drill down report that shows matters they are not supposed to see. This can be controlled by disabling Drill to Anywhere. When the Drill to Anywhere setting is disabled, the user won't be able to use the feature. However, a custom drill-down (custom hierarchy) that is built within an eCube is still available for the user and will allow a controlled drill down giving the user access to details they can see. The information below applies to all versions of Sisense.
By default, “Drill to Anywhere” feature is disabled for the report viewers to prevent access to sensitive information. However, report designers and owners still have the ability to enable drill to anywhere setting for report viewers if required.
Note: These steps are intended for our internal services team but can be done by clients who manage their TeamConnect instance on premise.
Best Practices
- We propose to always disable the Drill to Anywhere option when creating widgets so users who do not have the required security permissions are not able to get to information through the drill-down option.
- Custom hierarchies can be managed manually by connecting to the services team and following the steps below.
Enable Drill to Anywhere
The Enable Drill to Anywhere option is enabled/disabled at the Widget-level or the Role-level (there is no "drill to anywhere" at the eCube level). This option will appear in the Widget-level when a widget is created or modified.
Custom Hierarchies
Hierarchies are the structures that enable the right-click drill-down capability on reports. Custom hierarchies allow you to limit the ways in which users can drill into data.
To create custom hierarchies, a user must have web admin access. On premise clients will be able to create their own, Hosted clients will need their custom hierarchies created by a Hosting web admin.
To create custom hierarchies - once the hierarchies are defined:
1. Log into the Sisense as a Web Admin
2. Browse to Admin, select Data Source
3. Choose your client's/your cube
4. Click the Actions vertical dots, and choose Manage Hierarchies

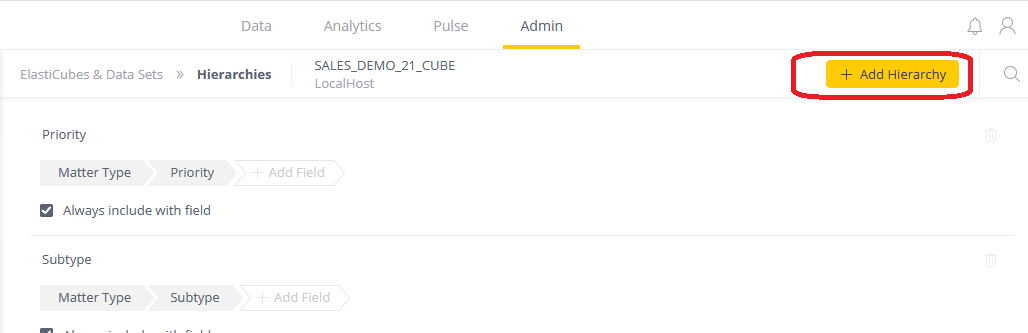
5. If this is the first hierarchy, there will be a blue link in the middle of the page. After building the first hierarchy, select the yellow button + Add Hierarchy.
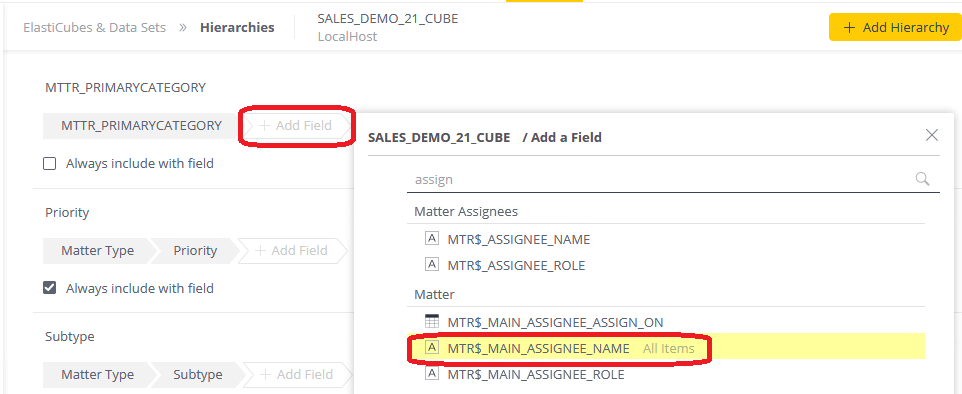
6. Select the field. To build the hierarchy, you have to select the fields by their actual field names rather than their friendly names. However, the drill options will use friendly names when viewed through the user interface.

7. Select which field to drill into; this can be multiple fields. Back on the Hierarchy page, click Add Field next to your new hierarchy then select the first level of drill down. Repeat this process for each level in the hierarchy, if you want multiple levels.
8. Always Include option. In version 7.1, we recommend you do not use the Always include with field option. The expected behavior is that any time you apply your field to a report, the hierarchy will always appear. The actual behavior is that any hierarchy with this box checked appears for ALL fields, not just the one you picked. This is a bug that will be fixed when we upgrade to the latest version of Sisense.

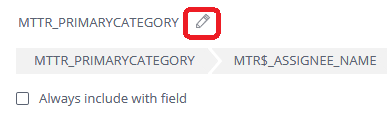
9. Rename your Hierarchy. To rename the Hierarchy, hover next to the name and click the Edit pencil. Enter the name, then click the green checkbox (name it so users will know which filter they are choosing). NOTE: you do not have to change the field names; the translator file will do that when viewed via the user interface.

10. Multi-level Hierarchies.
a. It is possible to do multiple levels in a hierarchy by continuing to add new fields. It is recommended to keep it at 10 or less for performance reasons.

b. It is also possible to do multiple hierarchies on the same field. Each hierarchy must have a unique name. Use names that indicate the content of the drilldown and not the name of the field it is being created for.

11. How to apply Hierarchies - this step is for Report Designers! On the report where you want to drill down - click the Pencil button to edit the widget. Then in the edit window, click the hamburger icon next to the field name that has hierarchies created and choose Hierarchies. Select the hierarchy you want to attach to the field, then click OK and then save the report by clicking Apply.


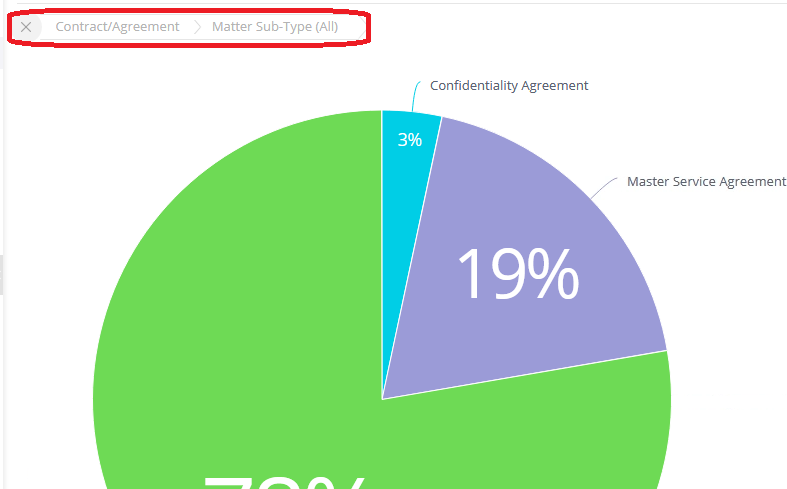
12. Custom drill down hierarchies are complete. Simply right-click on a report segment where you wish to drill down and select your Hierarchy. The graph will change to reflect the subset of data based on the segment where you drilled in. To clear the drill down, click the X next to the drill down details.
Note: Because Drill to Anywhere is disabled, selecting a custom Hierarchy is the only available drill down option.

13. If multiple drill down options have been applied to a field, it will look like this:

Quick FAQ
1. If the Drill to Anywhere setting is enabled when creating a widget, does the custom hierarchy overwrite that setting for that widget? - Drill to Anywhere is not associated with custom hierarchies in any way. What we turn on/off in the Drill to Anywhere is not impacting the custom hierarchy. Once the custom hierarchy is defined in an eCube, it will be available to all users regardless of whether Drill to Anywhere is enabled or disabled.
Adding a Widget Filter
To add a widget filter:
- Open the widget as described in Adding Widgets to a Dashboard.
- Click the Filters tab in the Widget Designer.
- The Filters panel is displayed showing the filters defined for this Widget. Click the Add Filter button to display the Data Browser, which lists the fields in the ElastiCube.
- Click on a field in the Data Browser to add it as a filter. You can define multiple filters, each for a different field. These filters have an AND relationship between them. Each filter that you define appears on the Widget Filters panel on the right enabling you to easily edit it if needed. The procedure for defining a Widget filter is similar to the procedure for defining a Dashboard filter. The difference is that the widget filter only affects its hosting widget, and is accessible only via the widget designer, not directly from the dashboard.
Creating and Editing a Formula for a Widget
For more information, see Reporting Formulas.
Configuring Tabular Widgets
To configure a tabular widget with columns:
- Click the Edit icon in the upper right hand corner of the widget.
- In the left pane in Edit mode, select which columns to display in the widget.
- In the right pane, click Design to set properties such as borders, column width, colors, word wrap, and page size.
- Click Filters to configure properties for filtering the data that appears in the table. The procedure for defining a Widget filter is similar to the procedure for defining a Dashboard filter. The difference is that the widget filter only affects its hosting widget and is accessible only via the widget designer, not directly from the dashboard.
- Sort columns in ascending or descending order by clicking the arrow in the column header.
To add text wrapping to the column:
- Click the Edit icon in the upper right hand corner of the widget.
- Select Edit Script.
- If there is no text, paste in the following script. If there is text already there, do a hard return at the end of the last line and add the following:
-
widget.on('ready', function(w, args){ $('td[fidx=5]', element).css('white-space','normal'); }); - Where "fidx=#" is the column number starting at 0 from the left side.
- Click Save and refresh the screen.
Adding Links to Widgets
Designers can configure a report to have "click-through" links that lead directly to the TeamConnect record.
To configure a report to include links to records:
- Navigate to the report and click the Edit (pencil) icon.
- Make sure that the Primary Key field of the object that that will contain the link is visible in the widget in order for the script to find it and link it.
- Click the Options icon and select Edit Script.
- Add the following lines to the report script:
widget.on('ready', function(se, ev)
{ prism.createDrillDown(widget, "<LinkedColumnName>", "<PrimaryKey>", “<ObjectID>", "_<location>", "<TeamConnectURL>"); }
);
Where :
<LinkedFieldName> is the field/column in the widget that you want to link to the individual TeamConnect records.
<PrimaryKey> is the Primary Key field of the Object that the link is added to. (Note: when using the Aggregation option, An Primary Key field requires "Total" appended to the beginning of the Primary Key name. For example, instead of Contact Primary Key, you would use "Total Contact Primary Key.")
<ObjectID> is the object ID of the Object that the link is added to.
<location> is where you want the information to opened:
- "_parent" opens the linked document in the parent frame
- "_blank" opens the linked document in a new window or tab
- "_self" opens the linked document in the same frame as it was clicked
<TeamConnectURL> is the URL of the TeamConnect instance
For example, your script may look like this:
widget.on('ready', function(se, ev)
{ prism.createDrillDown(widget, "Project Name", "Account ProjectID", "DISP", "_parent","http://company.teamconnectURL.com:9005/TC_Instance"); }
);
- Save the script. Do not click Apply as the script will not save correctly.
- Refresh the browser. The step is necessary in order to save the script correctly.
Note: Only a field that has unique values can be used to identify the proper record on a click through link. When creating a click-through link via scripting on a report, do not have the link appear on values that are non-unique.
Script to Hide the Primary Key
Users can create the hyperlink on the entity level tables and hide the primary key by using the below script. The following is the script to hide primary key:
widget.on('ready', function(se, ev) { prism.createDrillDown(widget, "Contact Name", "Contact Primary Key", "CONT", "_self","http://perdita.qa.mitratech.com:7862/tomcat_tcbi"); } );
Note:
- Contact Name, Contact Primary key and TC url in the above mentioned script are taken as examples. Users need to replace them with the exact field names which they are using to create the report.
- Script to hide and hyperlink the primary key does not work with pivot table.
Showing Values Inside a Pie Chart
By default, slices in a pie charts show percentages instead of values.
To change percentage to values:
- When creating the pie chart, make sure the chart has Category and Value fields and that Value and Percent labels are selected.
- Click the Options icon and select Edit Script.
- Add the following lines to the script:
widget.on('ready', function(w) {

// Get the data objects
var data = w.queryResult.series[0].data;

// Find the formatted data values
var labelElements = $('g.highcharts-data-labels',element).children();
// Loop through each value label and save the text
var labelValues = [];
$.each(labelElements, function() {
// Get the current value label
var newValue = $('tspan',this).last();
// Save the value
labelValues.push( newValue.text() );
// alert(newValue.text());
// Remove the outside value label
newValue.remove();
});

// Find the inside value label
var labels = $('text.pie-percent-label',element);

// Pass the formatted labels to the front end
for (i=0; i< data.length; i++) {
// Grab the matching value label
var myLabel = labelValues[i+data.length];
// Update the inside label
$(labels[i]).text(myLabel);
// Adjust the font size for the inside label
var fontSize = parseInt($(labels[i]).css('font-size'));
$(labels[i]).css('font-size',fontSize);
// Adjust the location for the inside label
var y = parseInt($(labels[i]).attr('y')) +10;
$(labels[i]).attr('y',y);
}
})
- Save the script. Do not click Apply as the script will not save correctly.
- Refresh the browser. The step is necessary in order to save the script correctly.
Dynamic Buckets - Group Data on Aggregate Values
The Dynamic Buckets add-on supports aggregating a column, bar, and line chart’s results into buckets. This enables you to dynamically or manually segment the result population into groups while still retaining the filtering functionality.
For more information on how to use dynamic buckets, refer to TCBI - Dynamic Buckets.
