
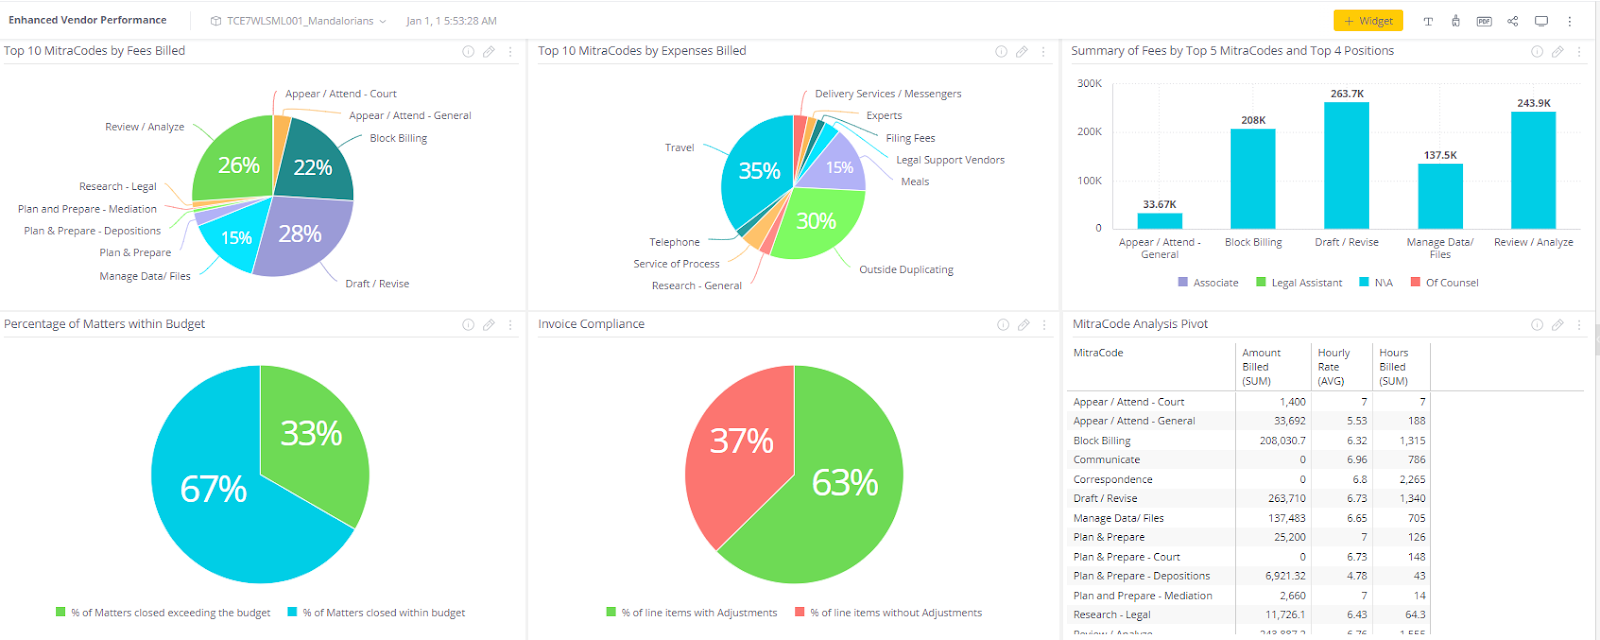
InvoiceIQ- Enhanced Vendor Performance Dashboards
TeamConnect Business Intelligence provides a number of starter dashboards. These dashboards can be tailored to your individual requirements, as they may not work with your system without customization, and you may need to remap certain fields based on your data model.
The minimum version that supports this starter dashboard is TCE 6.3.5, TCBI 6.3.0, and InvoiceIQ 1.1.
Introduction
The Enhanced Vendor Performance Dashboard shows law firm activities for a specific firm with InvoiceIQ metric overviews using widgets. An enhanced vendor performance dashboard is embedded in the contact record. Therefore, the dashboard will display the data for that specific contact. Note: Since the dashboard is most dependent on the Invoice Data, If the contact is not a vendor with much invoice management, the resultant dashboard may not provide the expected insights (Widgets may be empty)
This dashboard can be leveraged by accessing the Law firm contact and clicking on the separate tab created for it. For more information about configuring embedded dashboards, please refer to this link .
MitraCodes are Mitratech’s proprietary code for categorizing activities and expenses in InvoiceIQ and it is beneficial to clients in providing insights about law firms and attorneys activities.
This report provides users with a quick overview of metrics, as following widgets in the dashboards:
- Top 10 MitraCodes by Fees Billed
- Top 10 MitraCodes by Expenses Billed
- Summary of Fees By Top 5 MitraCodes and and Top 4 Positions
- Percentage of Matters Closed Within Budget
- Invoice Compliance
- MitraCodes Analysis Pivot
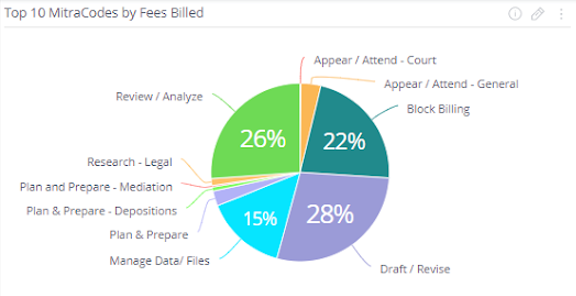
Top 10 MitraCodes by Fees Billed
This Widget Top 10 MitraCodes by Fees Billed, shows the top 10 MitraCodes by Fees type this law firm is billing for specific firms and amount billed for respective MitraCodes. The source data is invoice line items for fee lines with service dates within the last 12 months. Only Standard invoices with a posting status of Posted will be included in the report. This can be visualized in a following pie chart as the follows:
Top 10 MitraCodes by Expenses Billed
This Widget Top 10 MitraCodes by Expenses Billed, gives an overview of the top 10 MitraCodes of Expense type this law firm is billing for specific firms and the billed amount for respective MitraCodes. The source data is invoice line items for expenses billed with service dates within the last 12 months.Only Standard invoices with a posting status of Posted will be included in the report. This can be visualized in a following pie chart as the follows:

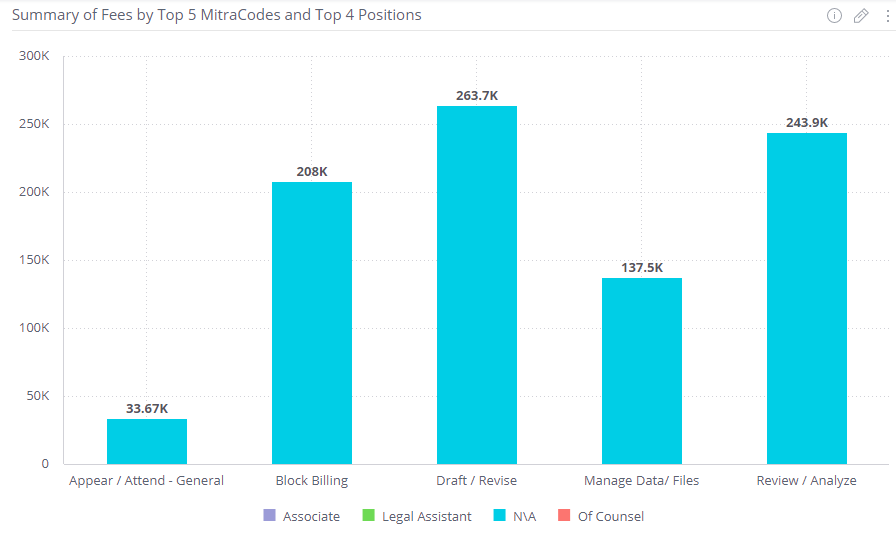
Summary of Fees by Top 5 MitraCodes and and top 4 Positions
This widget displays the information related to the summary of top 5 MitraCodes with respect to the fees charged by top 4 Positions (For ex: Partner, Associate, Paralegal, and Of Counsel) and how much they are billing for it. This can be visualized in a following bar chart as the follows:
Percentage of Matters Within Budget
This widget shows the Percentage of Matters Closed Within the Budget and exceeding the Budget respectively within the last 12 months. This can be visualized in a following pie chart as follows:
Note: Matters with no budget will be excluded.

Invoice Compliance
This widget shows the Percentage of line items with Adjustments (both manual adjustments and auto adjustments) and without Adjustments, within the last 12 months. Only Standard invoices with a posting status of Posted will be included in the report.This can be visualized in a following pie chart as follows:

MitraCodes Analysis Pivot
This widget displays the information related to Amount Billed(SUM),Hourly Rate(AVG) and Hours Billed(SUM) for each MitraCode.
- Amount Billed(SUM) = Net total value of amount billed for each MitraCode
- Hourly Rate(AVG) = Average Hourly rate for each MitraCode
- Hours Billed(SUM) = Net total hours billed for each MitraCode

Technical Specifications
Widget Name |
Parameters |
Obeys dashboard filters | Design |
|---|---|---|---|
|
Top 10 MitraCodes by Fees Billed |
Pie Chart of the top 10 MitraCodes based on the Fees billed for specific firms. |
Yes |
Pie type: classic |
|
Top 10 MitraCodes by Expense Billed |
Pie Chart of the top 10 MitraCodes based on the expenses billed for specific firms. |
Yes |
Pie type: classic |
|
Summary of Fees By Top 5 MitraCodes and and top 4 Positions |
Stacked bar chart that consists of top 5 MitraCodes as the bars and top 4 positions based on the fees billed for that specific MitraCode stacked on individual bars for specific firms. |
Yes |
Bar type: classic |
|
Percentage of Matters Closed Within Budget |
Pie Chart of the Percentage of Matters Closed Within the Budget and exceeding the budget |
No |
Pie type: classic |
|
MitraCodes Analysis Pivot |
Table that consists of all the MitraCodes which have been identified for specific firms, Sum of the Amount billed of respective MitraCodes, Average of Hourly rate of respective MitraCodes and Sum of the Hours billed for the respective MitraCodes. |
Yes |
N/A |
|
Invoice Compliance |
the Percentage of line items with violations and without violations |
No |
Pie type: classic |
Summary
As a quick summary, this dashboard addresses the following activities:
- How much Fees are billed for Top 10 MitraCode by each Law Firm for a selected firm?
- How much Expenses are billed for Top 10 MitraCode by each Law Firm for a selected firm?
- How much Percentage of Matters Closed Within and without Budget for a selected law firm for the last 12 months?
- How much Percentage of line items are there with and without Adjustments for a selected law firm for the last 12 months ?