
Working with Analysis Center
Opening Analysis Center
 Premium feature – A registration key code is required to activate.
Suite uses Analysis Center powered by SAP BusinessObjects Business Intelligence Platform in the Suite to create ad-hoc reports and queries. Analysis Center must be enabled in Suite Manager and a BusinessObjects server with a related universe must be installed for the site.
To Open Analysis Center:
On the eCounsel console, click on the Analysis Center module.

The Analysis Center module only appears on the eCounsel console if Analysis Center has been activated for your Suite user account. Contact your System Administrator for more information.
Creating a Report Using Analysis Center
Premium feature – A registration key code is required to activate.
Analysis Center is powered by SAP BusinessObjects Business Intelligence Platform, the leading Web-based query and analysis tool, designed to provide insight to the maximum number of users in an intuitive environment on a scalable platform. See Building Queries with SAP BusinessObjects Web Intelligence Query – HTML and Building Reports with the SAP BusinessObjects Web Intelligence HTML Report Panel documents provided by BusinessObjects for more information on Analysis Center interface.
To Create an Ad-hoc Report:
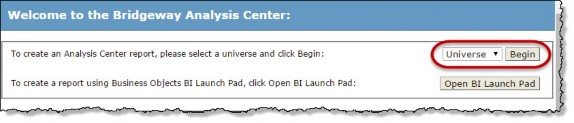
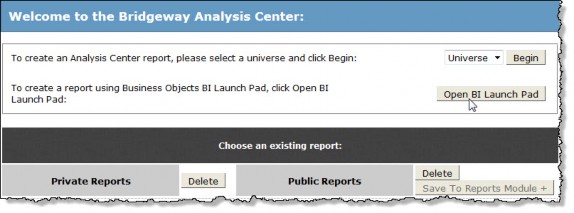
- On the home page, click on the Analysis Center module.
- Click Begin.
- Click Begin.
- A new page with a toolbar opens. Click the
 New button:

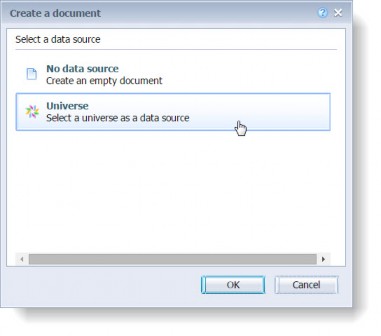
- The Create a document dialog box opens. Select the Universe data source and then click OK.
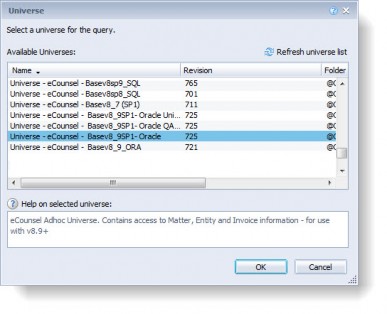
- The Universe dialog box opens. Choose the universe you want to use, and click OK.
- In Analysis Center, select fields from the universe that you want to see as results in your report, and click the right arrow button or drag-and-drop the field on the Result Objects list box.
- Select data on which you want to filter the report, and click the
 Filter button or drag-and- drop the field on the Query Filters list box.
 - Select an operator from the middle drop-down menu (for example, Greater than or Equal to).
- Select one of the following:
- If you use the default selection of Constant for the filter type, type a value in the blank text box.
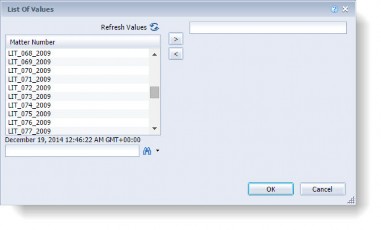
- To select from a value in a list, click the
 Filter Type button and select Value(s) from list. On the List of Values dialog box, double-click the value(s) to be used in the query, and click OK.
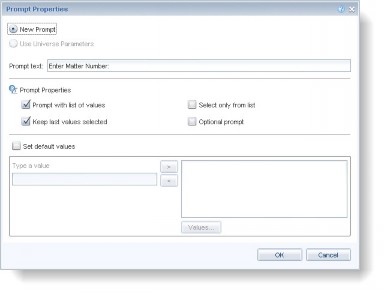
- To prompt for a value during report execution, click the
 Filter Type button and select Prompt. Click the
  Prompt Properties button to open the Prompt Properties dialog box to select any information concerning the value the report executor will be prompted to supply when he/she runs the report, and click OK.
- Click
 Run Query.
 - If you selected Prompt in Step 9, enter the value on which you want to filter data from the Prompts dialog box (if the value is in a list, click on the value, then click the left arrow button to move the value to the selected list), and click
 Run Query.
Creating a Chart from the Report Data
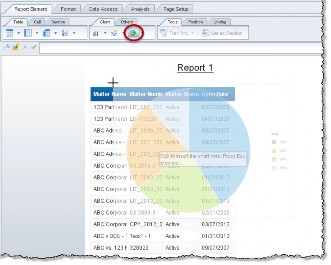
To create a chart from the report data, click the  Insert Pie Chart button at the top of the pane and then move your cursor to a spot on the report where you want to place the chart:
A placeholder pie chart is added to the report:
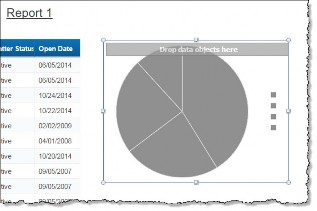
Drag dimensions into the placeholder pie chart and the data will display in chart form.
If you do not use a
 measure (a dimension that contains numeric data intended for calculations) when you create a chart, the chart will appear in greyscale and will not be very readable.
Saving a Report in Analysis Center
Saving the report as Private allows only you to access and run the report. Saving the report as Public allows you to identify the roles that have access to the report. All public saved reports from Analysis Center are visible in the Reports module under the selected category.
To Save an Ad-hoc Report:
- After running a query, click the
 Save button in Analysis Center.
 - On the Save Analysis Center Report dialog box, type a name for the report.
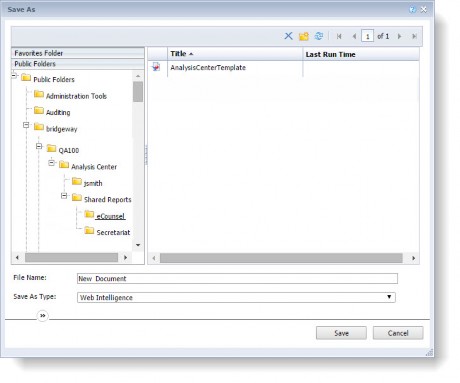
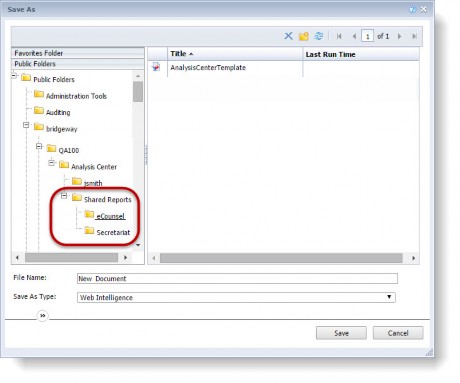
Note that Analysis Center reports may reside in a nested directory structure following these conventions:
- The root folder as defined by the Root BO Directory value in the Suite Manager BusinessObjects system settings (for example, bridgeway)
- A subfolder of the root folder from above matching the unique database identifier as defined by the Database Identifier value on the Database Properties Administrator page for Suite (for example, Suite8)
- A subfolder of the previous folder named Analysis Center
- A subfolder of the Analysis Center folder matching either the user’s Suite login name (for private reports) or Shared Reports (for public reports)
- A subfolder of the previous folder matching the Suite application (either eCounsel or Secretariat)
Following is an example of a directory that would be used for a public report:
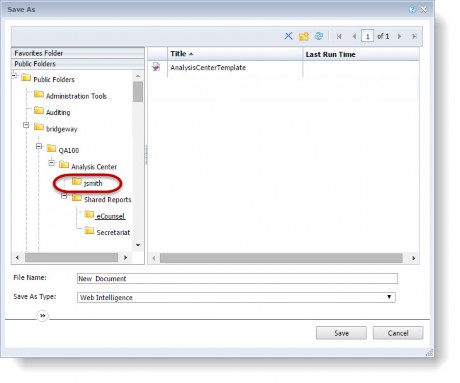
Following is an example of a directory that would be used for a private report:
- Click Save.
Modifying an Analysis Center Report
Ad-hoc reports (or reports on demand) can be created if you have purchased this premium feature from Suite. In addition, any report can be saved and modified at a later time if you are using SAP BusinessObjects Business Intelligence Platform.
To Modify an Ad-hoc Report:
- On the home page, click on the Analysis Center module.
- On the Analysis Center dialog box, select universe and choose a report by clicking on its name.
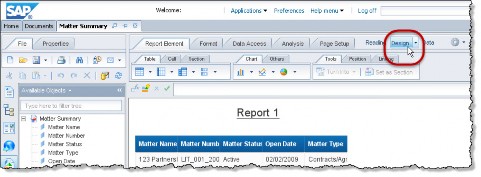
- Be sure you are in edit mode by selecting the Design button at the top:
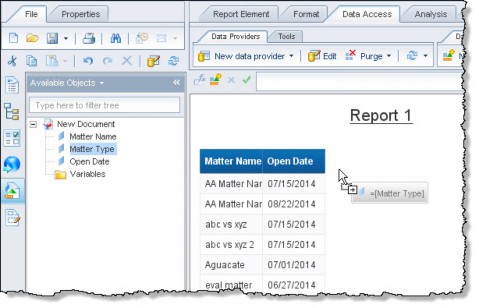
- Click the
 Edit Query button to make changes to the filters that return data and then click
  Run Query.
 - Drag the new dimensions to the report as needed:
- When you have finished configuring the report, click Save.
Deleting an Analysis Center Report
Any public or private report may be deleted from Analysis Center. To delete a report, select the report, click Delete, and confirm deletion by clicking OK. Analysis Center reports may not be deleted directly from the Reports module, but can only be deleted from Analysis Center.
Launching BI Launch Pad
Analysis Center includes the capability to create and modify reports using the BusinessObjects BI Launch Pad interface. BI Launch Pad must be deployed at your site and configured by a System Administrator, and you must have a security attribute assigned to your user account to launch it from within Analysis Center.
To Open BI Launch Pad:
On the Analysis Center window, click the Open BI Launch Pad button. Analysis Center provides your BusinessObjects user credentials to BI Launch Pad so that you are logged in automatically.

Publishing a BI Launch Pad Report
If a report is created using BI Launch Pad and made public in Analysis Center, the report must be published to appear in the Reports module.
To Publish a BI Launch Pad Report:
- Open Analysis Center.
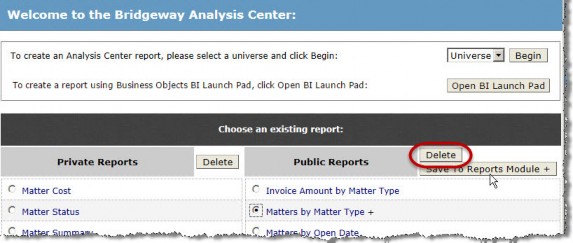
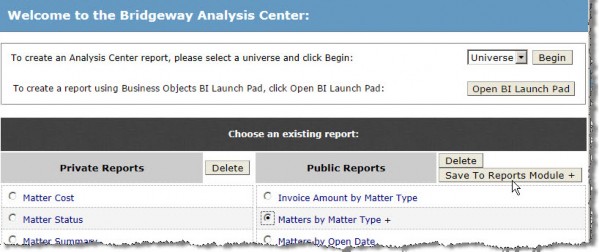
- On the Analysis Center window, any reports that have not been published in the Reports module appear with a plus sign (+) after the name of the report. Click on the report option button to select it.
- Click the Save to Reports Module button. (The button is only available for reports not saved to the Reports module.)
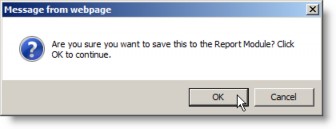
- On the message box confirming the publish to the Reports module, click OK.
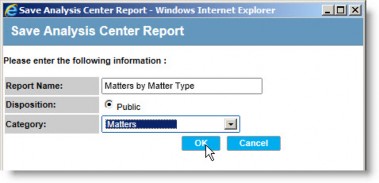
- On the Save Analysis Center Report dialog box, select a category for the report, and click OK.
Scheduling Reports with BI Launch Pad
To Schedule an Analysis Center Report in BI Launch Pad:
- On the eCounsel or Secretariat console, click the Analysis Center module.

- On the Analysis Center window, click the Open BI Launch Pad button. Analysis Center provides your Business Objects user credentials to BI Launch Pad so that you are logged in automatically.
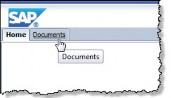
- On the Launch Pad page, click the Documents tab.
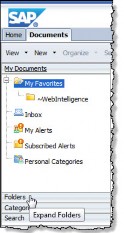
- Click Folders at the bottom of the navigation pane to display the folder tree.
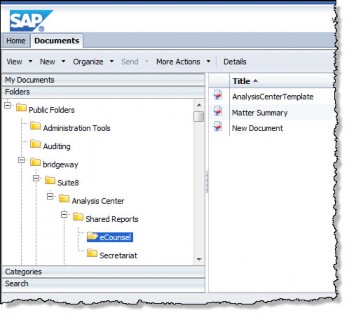
- Locate the folder containing the saved reports. Note that Analysis Center reports may reside in a nested directory structure following these conventions:
-
The root folder as defined by the Root BO Directory value in the Suite Manager BusinessObjects system settings (for example, bridgeway)
-
A subfolder of the root folder from above matching the unique database identifier as defined by the Database Identifier value on the Database Properties Administrator page for Suite (for example, Suite8)
-
A subfolder of the previous folder named Analysis Center
-
A subfolder of the Analysis Center folder matching either the user’s Suite login name (for private reports) or Shared Reports (for public reports)
-
A subfolder of the previous folder matching the Suite application (either eCounsel or Secretariat
-
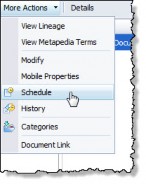
- Click the More Actions menu, and select the Schedule menu command.
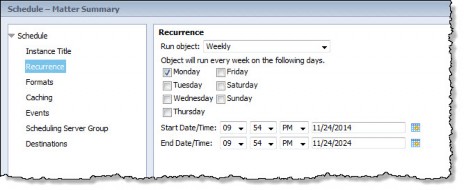
- In the Recurrence pane, select how often to run the report from the Run object menu. Options will vary depending on your selection.
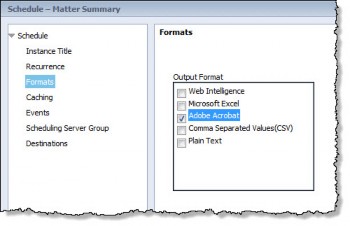
- On the Formats pane, select the format for the delivery of the report and the destination. This example specifies an Adobe Acrobat PDF file.
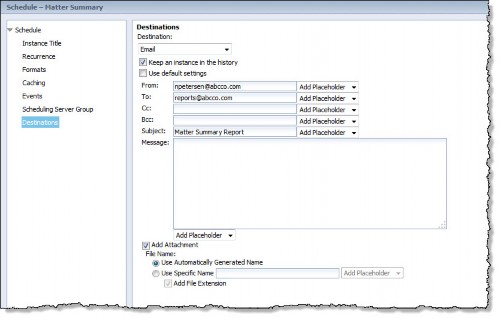
- On the Destinations pane, select the method of delivery and the destination. This example specifies that the file will be e-mailed as an attachment to recipients.
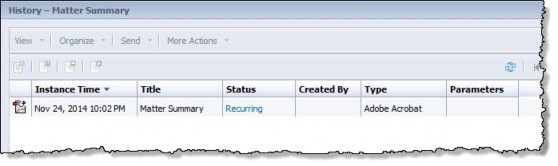
- Click Schedule. The report now appears in the list of scheduled reports.
- The Analysis Center report will appear in in the Legal Department Reports folder in Bridgeway E-mail Link for users who were scheduled to receive the report when the IMAP folders are updated.