CorpCharts
![]() You must have Microsoft Visio 2013 or 2016 Standard or Professional installed on your computer in order to use CorpCharts. Note that using Microsoft Visio 2016 requires Suite 8.11 SP6 or later.
You must have Microsoft Visio 2013 or 2016 Standard or Professional installed on your computer in order to use CorpCharts. Note that using Microsoft Visio 2016 requires Suite 8.11 SP6 or later.
CorpCharts is a powerful feature of Secretariat that provides a visual representation of a company’s ownership structure. CorpCharts takes the information entered on the Ownership tab and creates organizational charts using Microsoft Visio, a graphic charting program.
To create charts, the Corp Charts Access security attribute must be enabled in Suite Manager by an administrator for a particular user or group of users. Since all companies should be represented on the organizational chart, any WorldView security restrictions will not apply to entities appearing in the chart.
However, data for additional fields for entities to which the user does not have access will not appear on the chart.
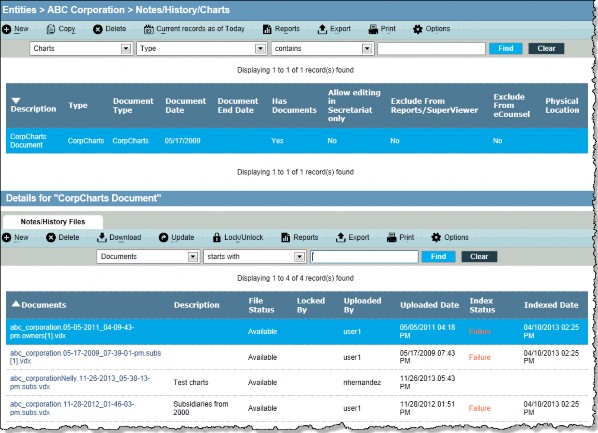
When you create a chart in CorpCharts, you can save the chart to the Notes/History/Charts tab within the Entities module. You can customize a chart in Microsoft Visio, and these customizations also will be saved to the Notes/History/Charts tab in the Details area for the entity’s chart record if you select to save the chart.

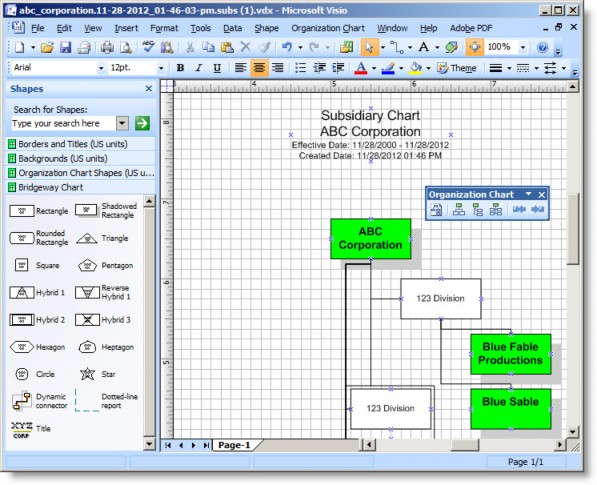
After you create a chart and then draw the chart, Microsoft Visio is launched when you select to open the chart. Make sure that macros are enabled (set macro security to Medium or Low in Microsoft Visio) before Microsoft Visio can render the chart. Within Visio, you can use any of the tools to modify the chart as desired. Mitratech provides an Organization Chart toolbar that allows you to change the default layout of the chart (from horizontal to vertical, etc.). Additional shapes are provided on the Shapes toolbox using the Chart stencil.


