Consultant Metrics Report
Consultant Metrics Report
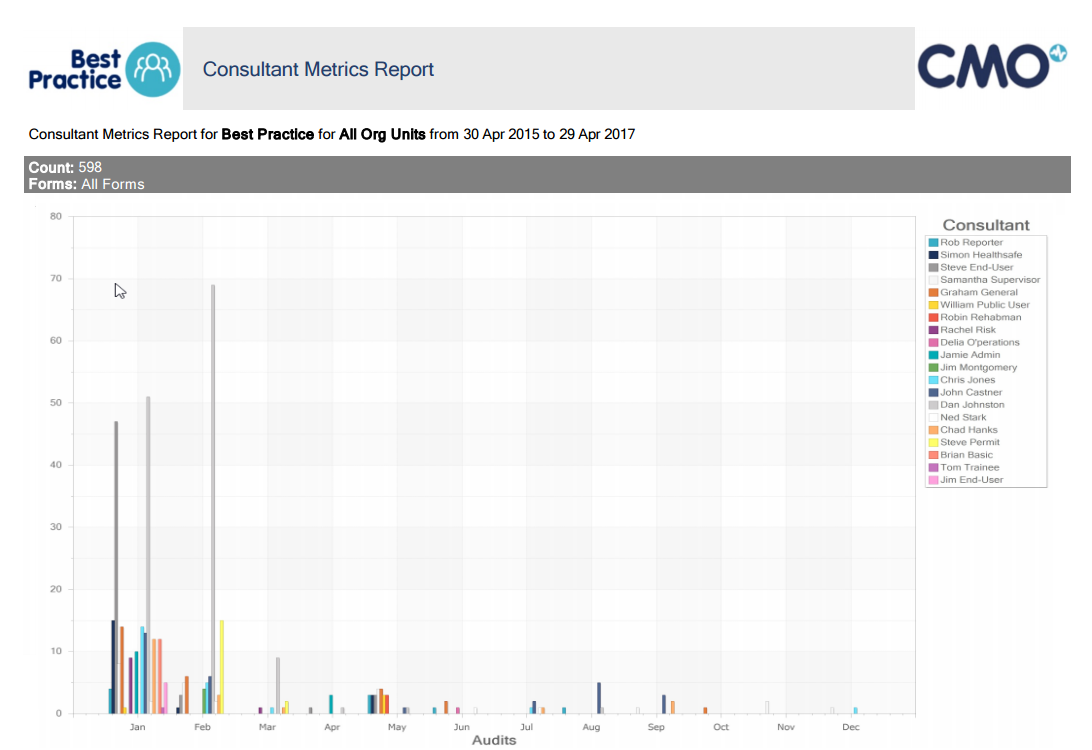
This report contains a series of three bar graphs which show the number of audits performed, the income generated, and hours worked by consultants.
Navigation
- Go to the Reports module in the navigation bar
- Select Standard Reports
- Locate the Consultant Metrics report from the drop down
Report Layout
The report layout displays in 2 sections from top to bottom:
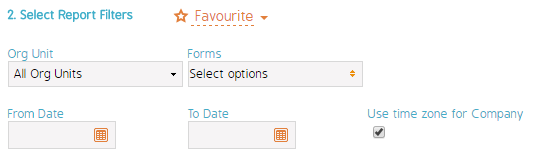
- Filters used
- Bar graph of events performed by consultant/reporter sorted by month
Report Filters
Report Sample