
Date Range Filter for Key Risk Indicators Widget
Date Range Filter for Key Risk Indicators Widget
CMO application allows the user to avoid needing to have separate widgets or dashboards to display the same content over different periods or having to constantly change the date settings on individual widgets to see data over different periods of time.
To implement this functionality, a new Date Range check box has been introduced in the Dashboard. The check box can be accessed by creating a new dashboard or editing an already existing dashboard.
For more information about Time Period Filter please refer to Time Period Filter For Dashboard Feature.
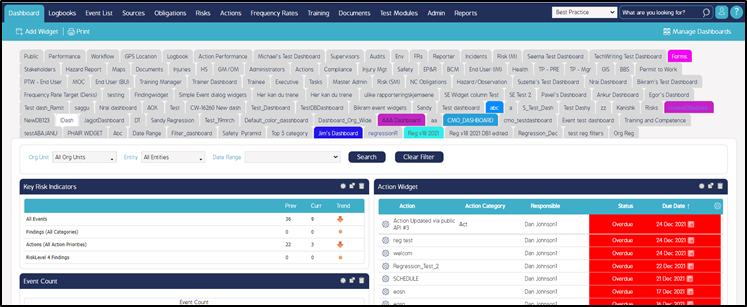
Steps to Add Key Risk Indicator Widget to the Dashboard
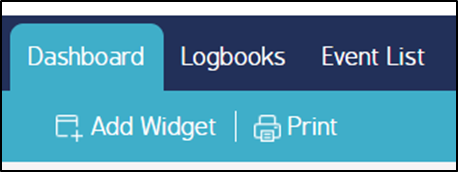
1. Go to Dashboard > Add Widget.
2. Select Widget screen appears.
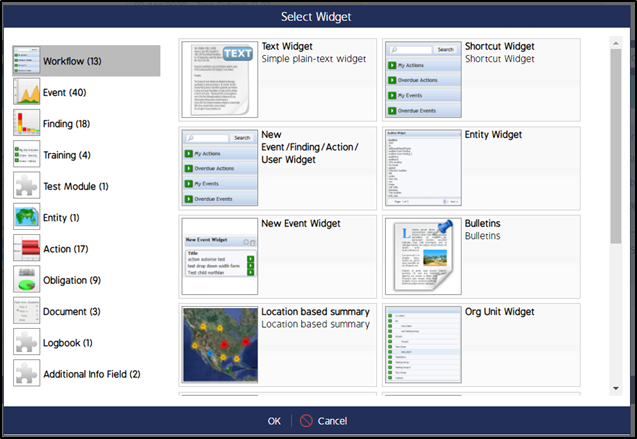
3. Click on Action/Event/Finding from the Select Widget screen. A list of available widgets under the Action/Event/Finding module will be displayed.
Note: The Key Risk Indicators widget is applicable for Event/Action/Finding modules.
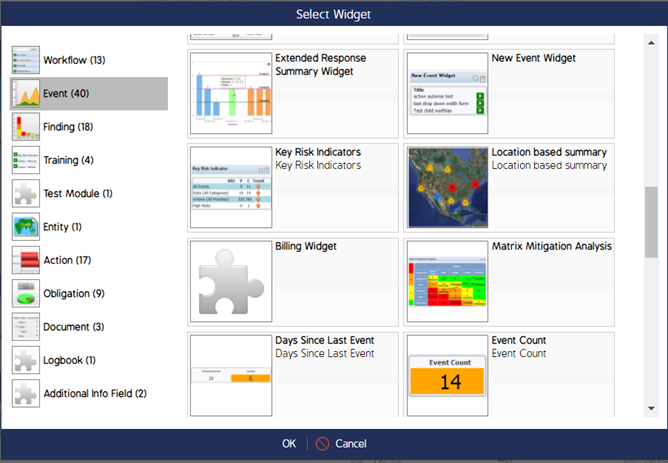
4. Scroll down to find and select Key Risk Indicators widget.
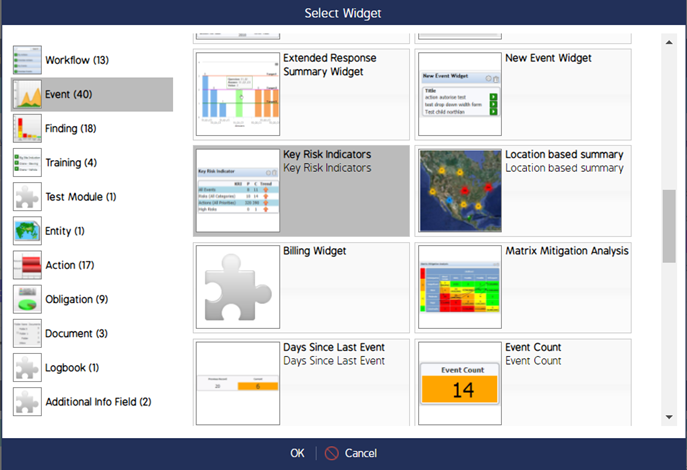
5. Click OK. The selected Key Risk Indicators widget will be added to the Dashboard.
Fetch and Show Key Risk Indicator Widget Data Based on Time/Period Filter
1. Go to Dashboard Module.

2. Select the desired Dashboard for which the Date Range filter is enabled.
3. From the Date Range filter, select the filter option for which the data should be displayed for the widgets. The Date Range filter has multiple filter options as shown in the following image.
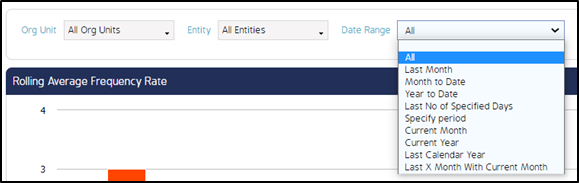
4. Select the filter option from the Date Range dropdown. The data in the widgets will be displayed according to the selected filter.
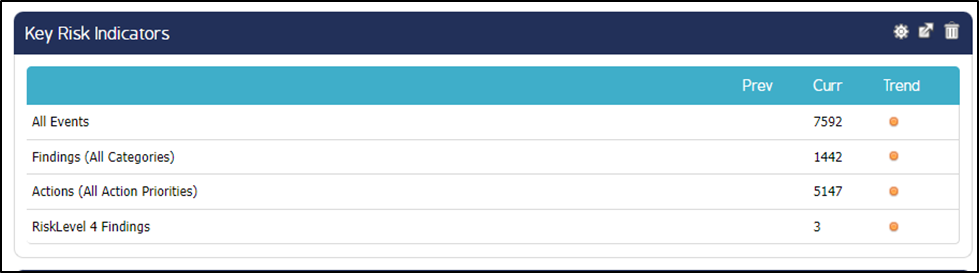
5. For example – The following is the default data shown for the Key Risk Indicators Widget according to the widget filter settings i.e., the due date for a period of last 30 days - from March 15, 2022 to Feb 15, 2022.
Note: The widget displays default data according to the widget filter settings when added to the dashboard.
6. When the global filter i.e., Date Range filter is applied, the system overrides the default widget settings and considers global Date Range filter settings for displaying the data accordingly. The following image shows the data when the Date Range filter is selected as Last Month.
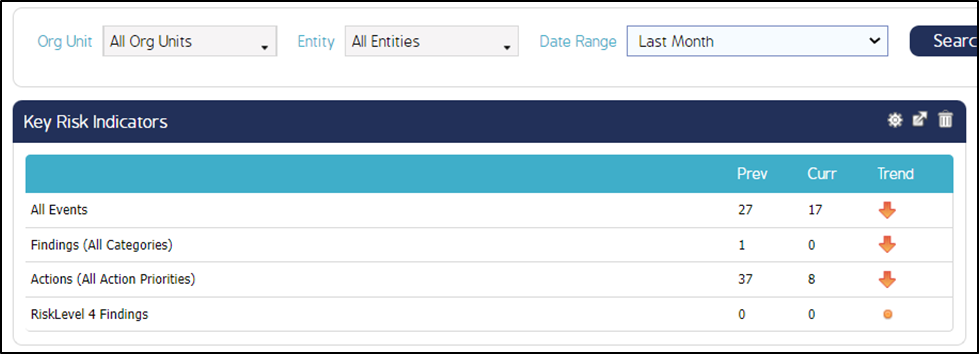
Similarly, the widget shows the data according to the filter option selected in the Date Range filter.