
How To Build A Dashboard
Dashboard Fundamentals
Dashboards are portals into CMO. When users login to CMO, they can land in a certain dashboard. Dashboards are made up of widgets that display data in the form of lists of records, charts, heatmaps, or risk matrices. Dashboards can also organize shortcuts to enter different forms. Accessibility to access and edit dashboards is controlled by Role assignments. Dashboards can be available to the whole organization or limited to an individual or to all the users (public access) without loggin into the CMO application.
Dashboard Architecture
Before we build a dashboard, it is important to understand what we are building. Observe the sample dashboard below.
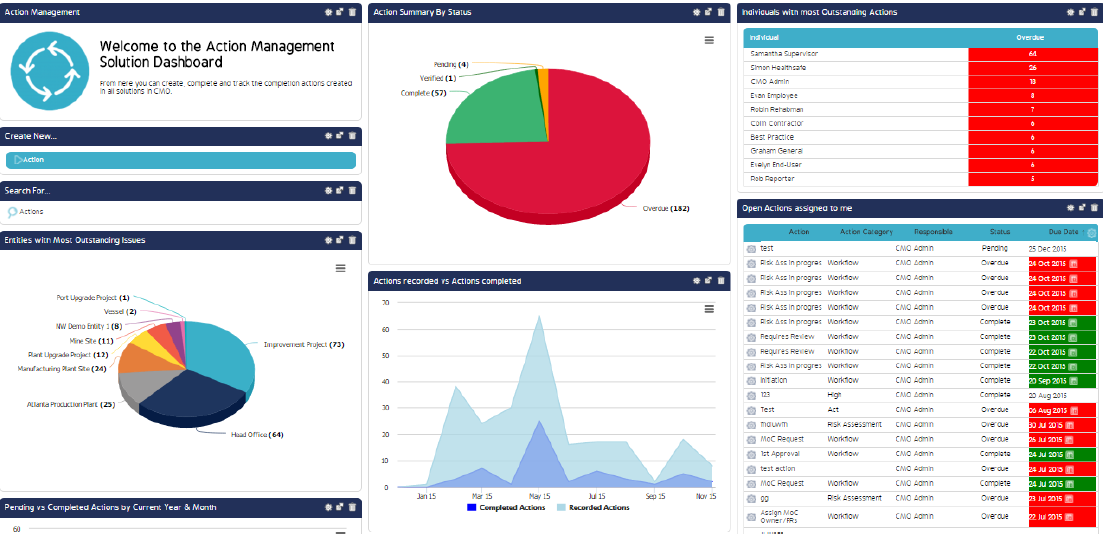
You can design your dashboard with one to four columns. The one above for instance has three. Each of the sections above is a separate widget. There are over 100 different pre-built widgets available. Although they are pre-built, in most cases will still need to do light configuration to filter the information you want to display.
Creating The Dashboard
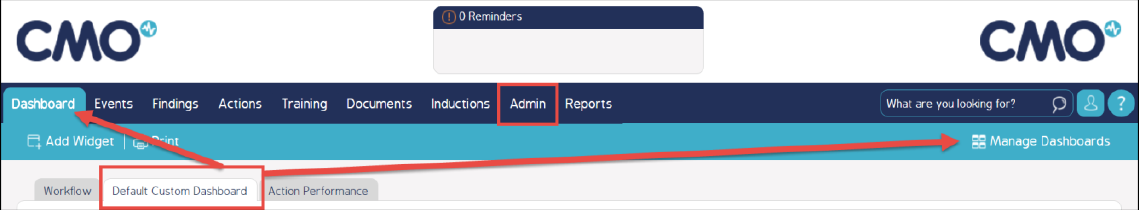
Go to Admin > Dashboard tab (make sure you are in the Default Custom Dashboard tab or wherever you can see Manage Dashboards) > Manage Dashboards.
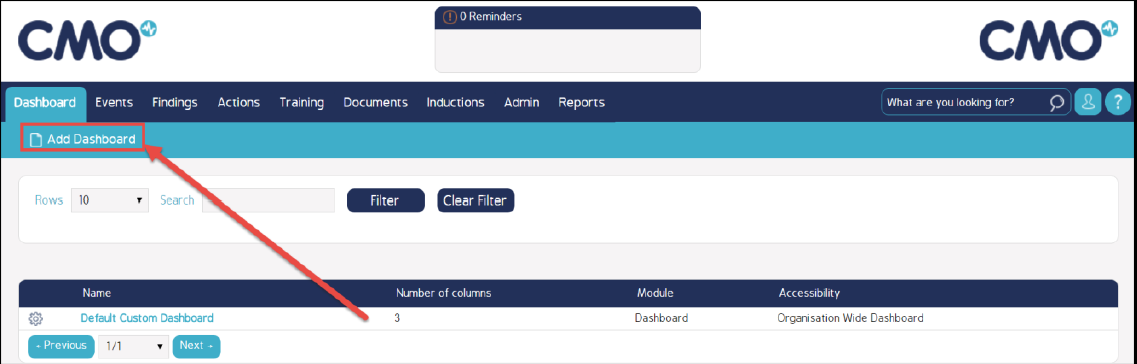
There will be a screen listing all the dashboards in your company. Click on Add Dashboard.
From this point, the New Custom Dashboard configuration screen will pop up as shown below.
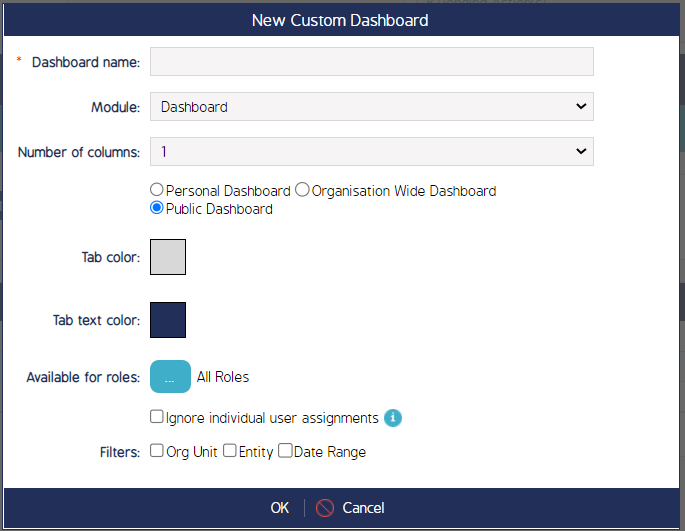
In this screen the following options are displayed:
- Dashboard name: Enter a name that is appropriate to the dashboard
- Module: Leave as “Dashboard”
- Number of Columns: Choose between 1 and 4 (your widgets diminish in size the more columns you create)
- Personal/Organization Wide/Public: Whether this is just for your personal use or for everyone or for public (user can access dashboard without logging in to the CMO application).
- Tab color: The user can choose the color the dashboard tab to be displayed
- Tab text color: The user can choose the color of the text of the dashbaord name to be displayed
- Available for roles: Click on the … icon and choose the roles that will be able to see this dashboard
- Editable by: Click on the … icon and choose the roles that will be able to edit this dashboard
- Ignore individual user assignments is only available for limited widgets
- Filters: Will provide the option of filtering the entire dashboard by Org Unit/Entity/Date Range
- Click OK at the bottom of the box to close this window
Adding Widgets
Next, the Select Widget screen will pop up, as seen below:
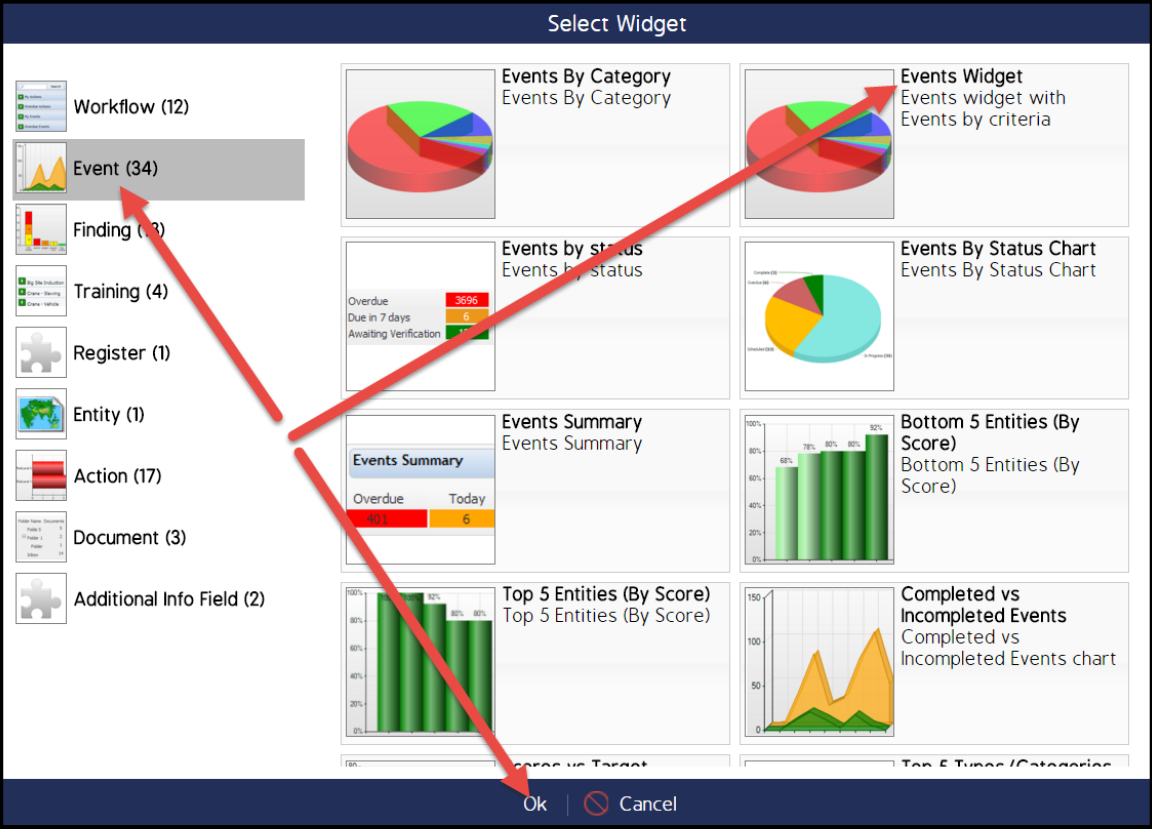
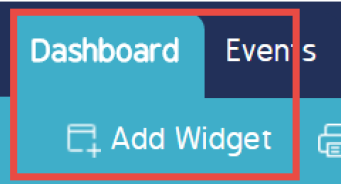
NOTE: If you ever want to get back to this screen, go to Dashboard > Add Widget shown here:
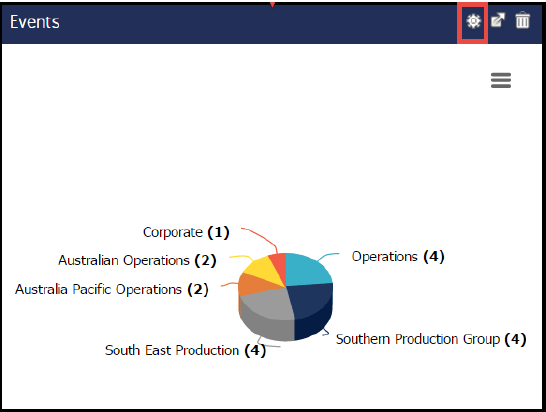
To start, click on Event > Events Widget. Then click Ok. The widget will appear on your dashboard looking something like the following (depending on your org structure and the existing data in your system). To further configure the widget, click on the cog wheel in the upper right hand corner.
The following screen will display:
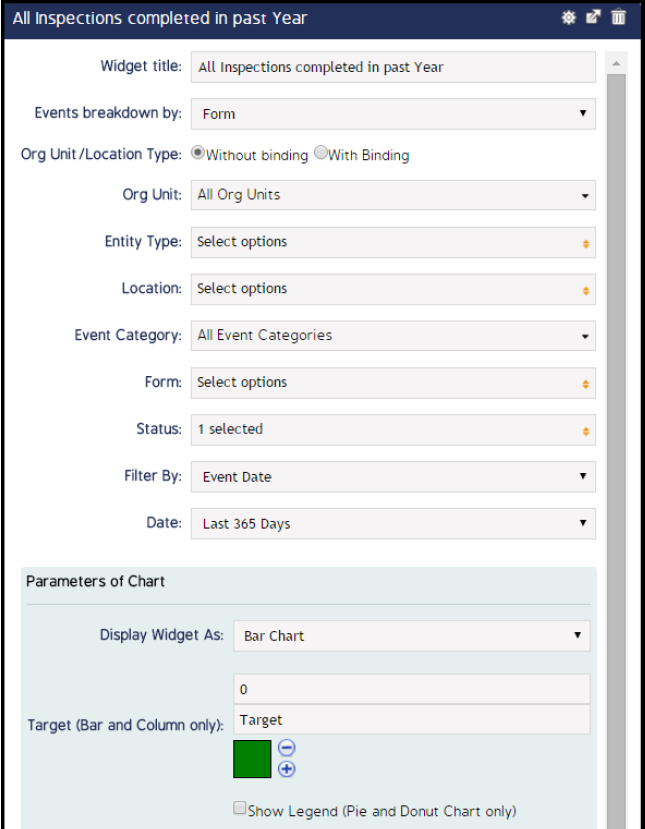
The following are the Widget informational fields and their corresponding descriptions:
- Widget Title: Create a clear title such as “All Inspections Completed in past year”
- Events breakdown by: Select “Form” to see how many of each form / event have been completed
- Org Unit / Location Type: Without binding allows you to select only to the Org Unit level – With Binding goes down to the Location level
- Entity Type: Can filter on Entity Types if you have created them
- Location: Can filter on locations here or in Org Unit/Location Type above – multiple selections can be made
- Event Category: Can filter on Event Categories if you have created them
- Form: Can filter on multiple Events/Forms
- Status: Select Complete (and/or Closed, depending on your statuses) if you only want to show Completed forms
- Filter by: Event Date is usually used for forms while Due Date is used for Actions
- Date: Select date range
- Parameters of Chart: Choose as desired
Click the file icon at the bottom of the screen to save. Your Widget will look similar to the one below:
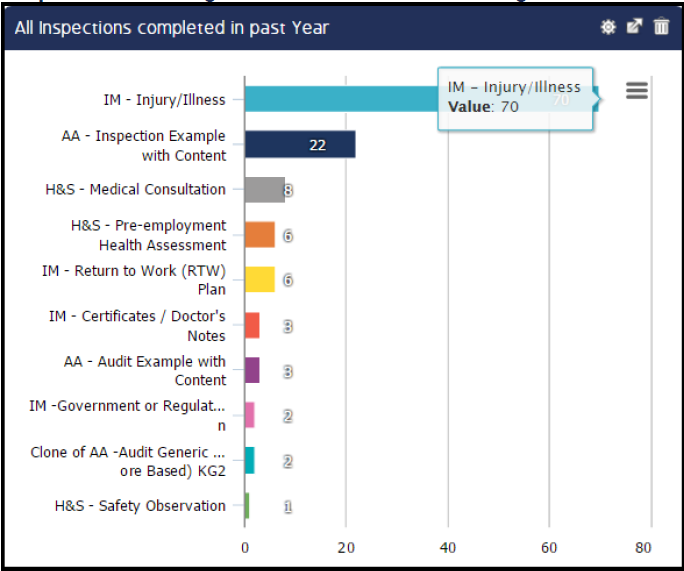
This is one of several widgets used to make up a dashboard. Add as many needed.
Video Demo
Coming soon...