How To Configure The Events Widget
Configuring The Events Widget
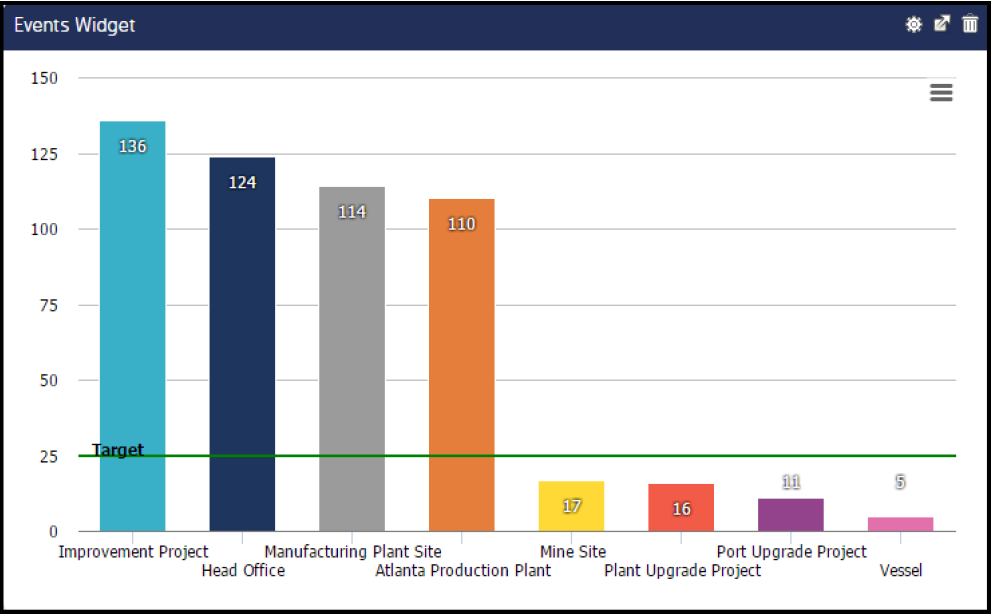
The Events Widget is very simple to configure yet very versatile in the information it can display. It is ideal for displaying global event numbers, by form, by site, or by org unit as seen in the example below.
Creating And Configuring The Events Widget
Go to Dashboard > Add Widget > Event and click on Events Widget. Click OK at the bottom of the screen.
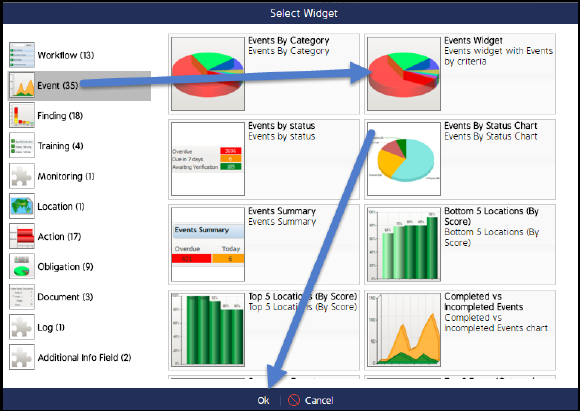
The widget will display in the top left-hand corner of your dashboard. Drag it to where you would like it to display.
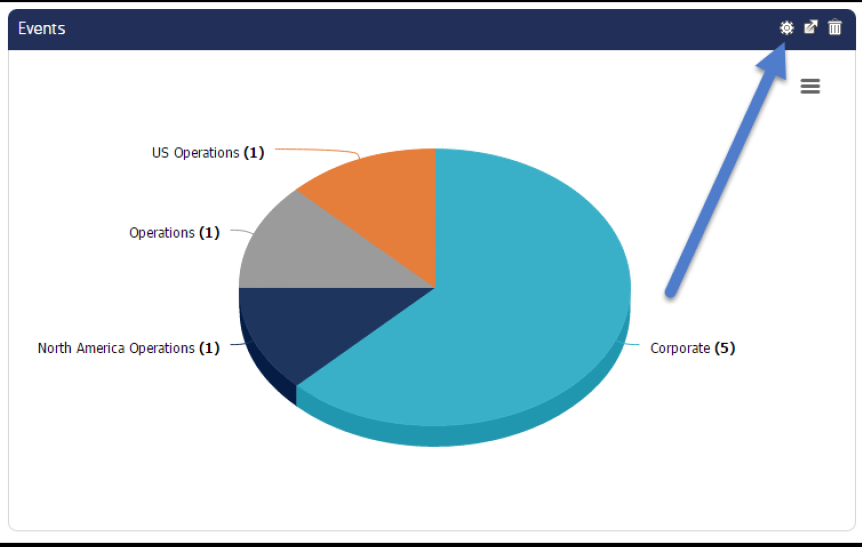
It will likely display data, such as shown below. Review the display of data and determine what you want to display (which events, for which part of your org structure, for what time period, in what format – Pie chart, Bar chart, Column chart…)
Click the cog wheel in the top right-hand corner to go to the configuration screen.
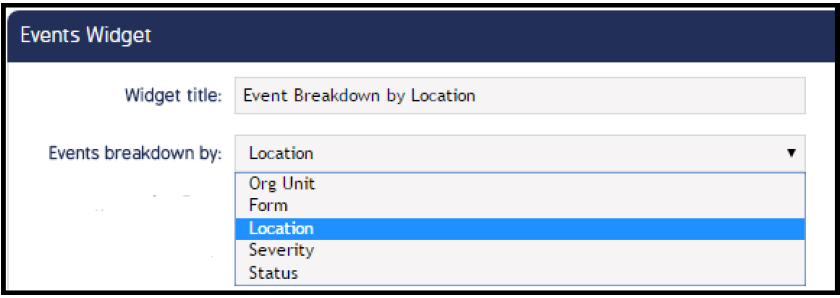
In the Configuration screen enter a Widget Title.
Events breakdown by: Allows you to choose the criteria for the data display. The default is Org Unit, which is shown above.
The following filters are available if needed:
Org Unit/Location Type: If you choose With Binding (as shown) the Org Unit and Location fields will display in parallel. If Without Binding is chosen, the filters will display in consecutive order. The same results can be achieved by either choice.

Event Category: If you have the selected event category assigned to a response in your event, the event will display in the widget.

You may select multiple forms. If this is chosen in conjunction with Event Category above, only the forms with the Event Category in the Forms selected will display (there is an AND modifier with these filters, not OR).
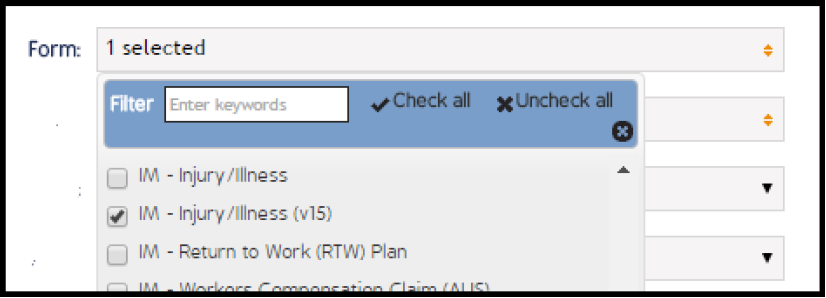
You may also filter on multiple statuses.

You may select various date filters. You may also click Specify period and select a specific date range.

Additionally, you will have 4 chart types to choose from.
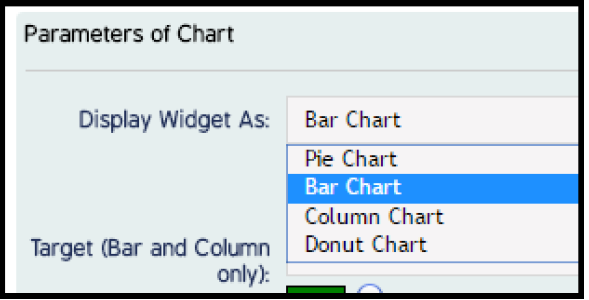
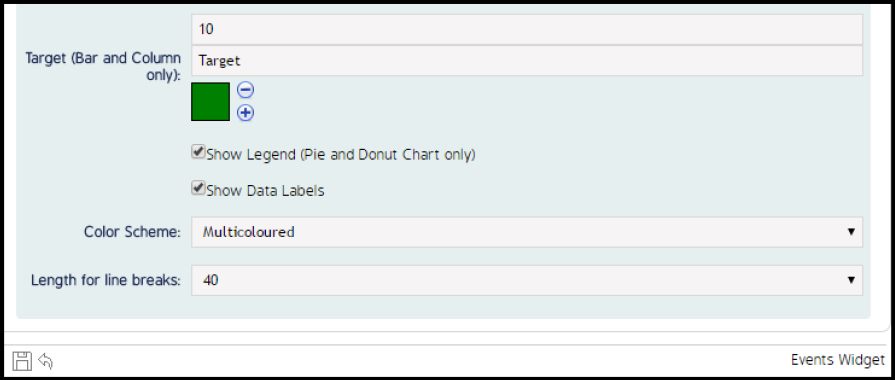
You may have a target line display on bar and column charts.
You may show a Legend for Pie and Donut charts (see below) and/or show data labels.
Color Scheme: Multicolored as shown below or monochrome.
Click the file icon at the bottom of the screen to save the configuration. You will then be returned to the dashboard where you can view your widget.
See the example below for a completed Events Widget.
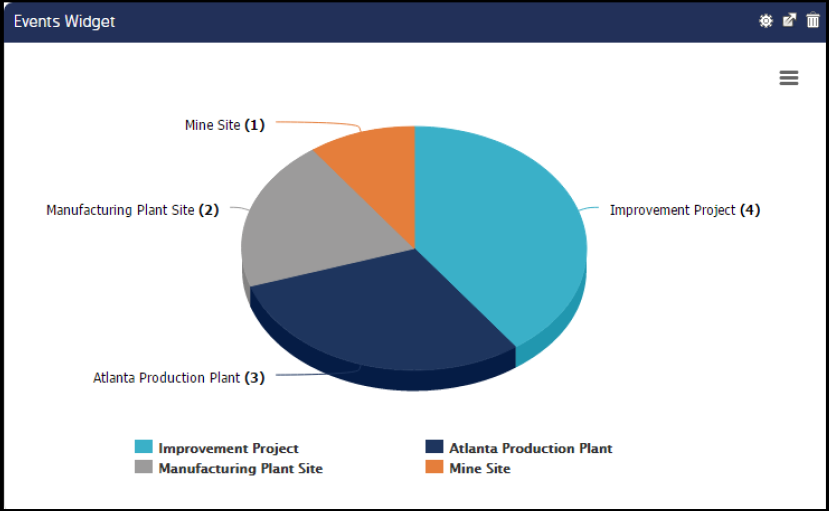
Final notes on navigation from the Widget window:
Cog Wheel: To get back to the Configuration screen.
Arrow Coming out of Box icon: To view the widget in full screen mode.
Trash Can: To delete.
![]()
Video Demo
Coming soon...

