
Dashboards
What are Dashboards?
Acuity Dashboards provide valuable insights into our clients’ legal spend, matter and law firm management. The Dashboards are based on current data in your Acuity system and provide tools you can use to interact with them. These Quick Tips will guide you through dashboard navigation and highlight tools to help you benefit from all features.
For video instructions on using this reporting tool, see How to Use Dashboards
Note: Dashboards show trends for the last 5 years. If you need to access even more data, see Data Download
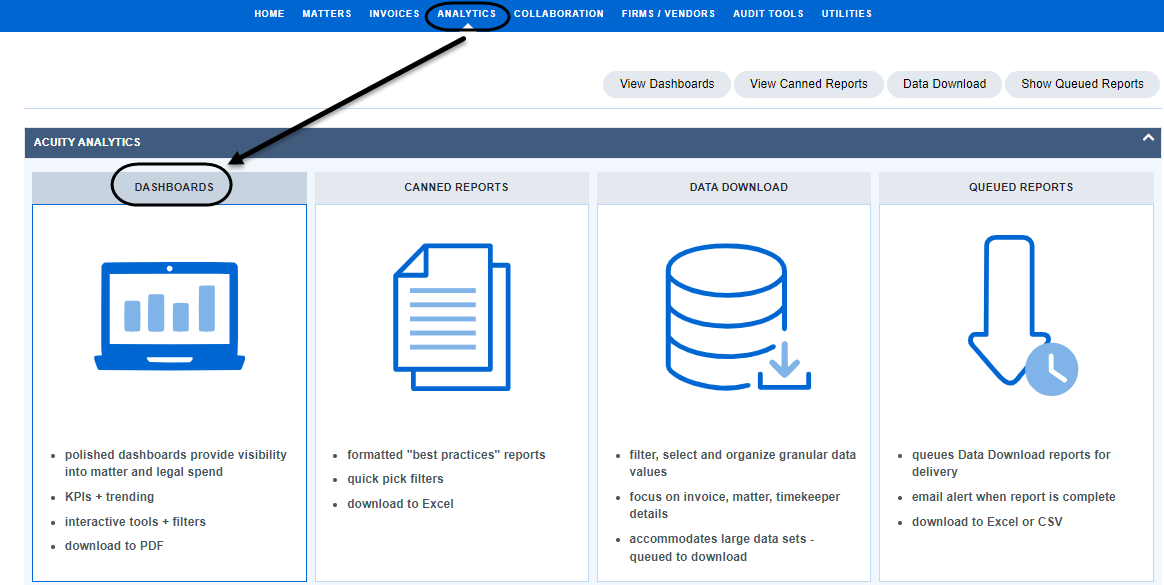
Locate Dashboards
-
Click on ANALYTICS in your top navigation, then select Dashboards.
-
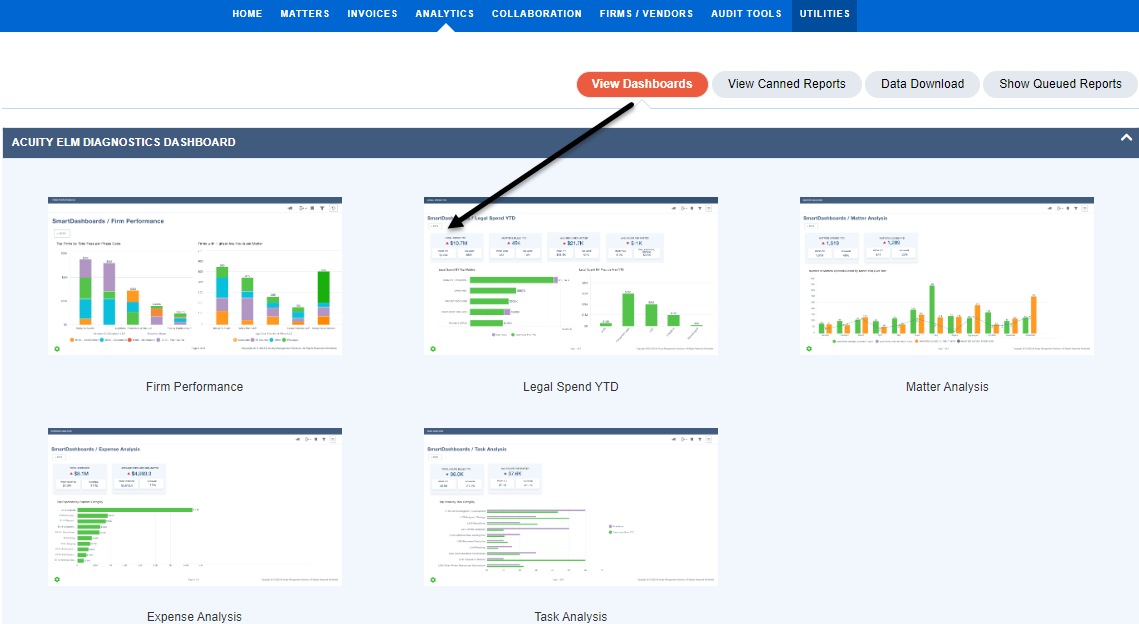
Click on the desired dashboard image to access that dashboard.
Dashboard Features
Dashboards will typically include:
-
Key Performance Indicators (KPIs) across the top – giving you high level metrics on how you and your firms are performing YTD compared to the same period last year.
-
Interactive graphs highlighting segments of your data – such as your top 10 billing firms for the current period.
-
Tools you can use to interact with these dynamic dashboards, including:
- Lassoing
- Filtering
- Exporting/Expanding
- Setting Bookmarks
- Setting notifications for delivered reports

Lassoing
To zero in on a specific aspect of your dashboard quickly, use your cursor to drag-select a part of a chart to filter to that level.

-
The selected chart, any KPIs at the top of your dashboard, and any other charts on the dashboard will update to show the details of the specified selection.
-
A “breadcrumb” filter card appears at the top of your charts.

-
Delete the filter card to return to the previous view.

Filtering
Dashboards have additional filter options that let you explore subsets of the data.

-
Click the
 Filter Symbol at the top right of the dashboard page to use the standard filters.
 -
Click on the specific filter you want (such as Firm Name) and search on filter values to narrow your selection.

-
Click Apply to refresh your chart or dashboard to show your data as filtered by your selection. Breadcrumb filter cards will appear at the top right of the dashboard.
-
Undo filters by clicking the ‘X’ on the filter card.
Exporting | Expanding
Any dashboard can be exported to a PDF. Click the Export button at the top right to choose your export.

Individual chats and reports can be expanded, and then exported to either a PDF or Excel spreadsheet.
-
To expand a chart, click the Maximize arrows in the top right corner.

-
To export a chart, click the down arrow to view Dashlet Actions, and choose “Export As”

Customizing | Bookmarking
You can save a customized version of a dashboard page by bookmarking it. A bookmark saves your filter settings.
-
After you’ve made your desired filter selections, click the
 Bookmark Icon at the top right corner of the dashboard page to save your customized filter.

-
Click Add (+) and enter a bookmark name/description.
-
Click the check mark to save the bookmark.
-
Click the Bookmarks button in the top bar menu to close the panel.
- You can create multiple bookmarks to provide easy access to your favorite filters.
Notifications | Report Delivery
Create a notification that sends a report or dashboard to one or more email recipients. Share an individual report by clicking the  Notifications icon from the report.
-
Click Add (+) to open the Create Notification Window

-
Add the notification name, emails, message, frequency, time, and time zone in the corresponding fields.
-
When sending a notification to multiple recipients, separate email addresses with a semicolon and no spaces.

-
Save the notification using the “Save” button
-
Select “Done” or click on the
icon to close the panel.
-
To see or edit any of your notifications, click the Notification Button.
-
Share a complete dashboard by clicking the Notifications button at the top right of the dashboard, then click the Add button in the notifications center.
Note: If you are not seeing the the Dashboard option under the Analytics main navigation reach out to your Super Admin/System Administrator to see if this can be added to your permissions. Not all users are set up for Dashboards.