
How to gather the HAR file from Chrome, Firefox, Safari and IE
HAR files are used to gather performance data from the end-users' web browser. It will capture objects, and response calls that a webpage generates.
Additional metrics that can be gathered by HAR are:
- Length of time that it takes to connect to the server
- Length of time to gather DNS information
- Length of time that it takes to transfer assets from the server to the browser
- Length of time that an object takes to be requested
How to generate a HAR and log file in Chrome
- Open up chrome browser and/ or install Chrome
- Click F12 and you will see the developer console on the right hand side appears
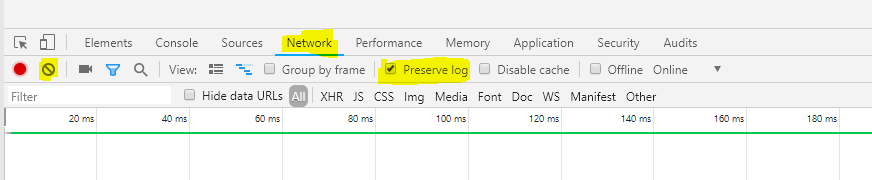
- Select Network tab, check Preserve log checkbox
- Click second button from left to clear history (highlighted)
- Put the URL we have requested into the browser and wait until the final page loads.
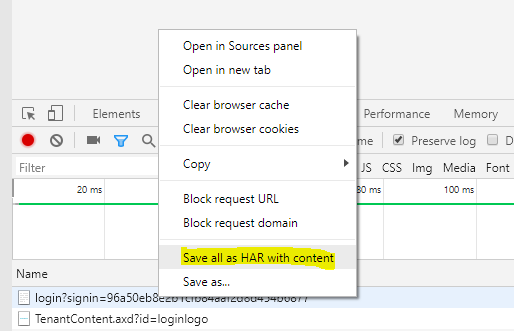
- In the results grid right click 'Save all as HAR with content'
7. Send Mitratech the exported HAR File(s) so our Teams can see all the network communications.
How to generate a HAR and log file in Firefox
- Open Firefox.
- In Firefox, go to the webpage in question.
- Select the Firefox menu > Web Developer > Network.
- Within the Networks tab, select Preserve log option.
- In the center of the Networks tab select refresh.
- Refresh the page and allow Firefox to record the browser-website interaction.
- Once the page is loaded, right click and "Save All As HAR".
- Select the Console tab and right-click on in the console box. Select all and Copy Message
- Copy log messages to the preferred text editor.
- Upload the HAR and log files to the support ticket.
How to generate a HAR and log file in Safari
- Open Safari.
- In Safari, go to the webpage in question.
- Enable Developers Tool: Safari > Preferences > Advance > Click Show Develop menu in menu bar
- Select Develop in menu > Show Web Inspector > Select Network tab
- Within the Networks tab, select Preserve log option.
- Refresh the page and allow Safari to record the browser-website interaction.
- Once the page is loaded, click on Export on the top right in the window of the Network tab.
- Select the Console tab and screen capture the errors.
- Upload the HAR and console screenshot files to the support ticket.
How to generate a HAR and log file in Internet Explorer (IE)
- Open IE.
- In IE, go to the webpage in question.
- To open Developers Tool, press the F12 key on your keyboard, or you may find the Developers Tool in the menu.
- In the Developers Tool menu > Network panel and then deselect the Clear entries on navigate option. (Default)
- Select Start Profiling Session/Start Capture.
- Refresh the page and allow IE to record the browser-website interaction.
- Once the page is loaded, click on Export as HAR/Export capture traffic icon and save
- Click on the Console tab and look for any errors/warnings reported. If errors are shown, please right-click on the console errors and select Copy all.
- Upload the HAR and log files to the support ticket.