Extended Response Summary Widget Configuration
Configure the extended response summary widget.
The Extended Response Summary widget displays responses from multiple Form questions. This widget is useful for tracking the responses of daily inspections that must occur, for example. The instructions below detail how to create and configure the Extended Response Summary widget, and how to configure the display of the widget.
- Log in and navigate to the Dashboard module.
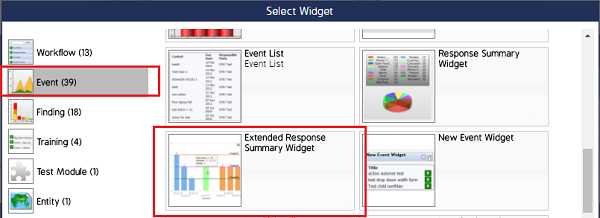
- Select the Dashboard you want to add the widget to, then click +Add Widget. The Select Widget screen will appear.
- Click Event, select Extended Response Summary Widget, then click Ok.
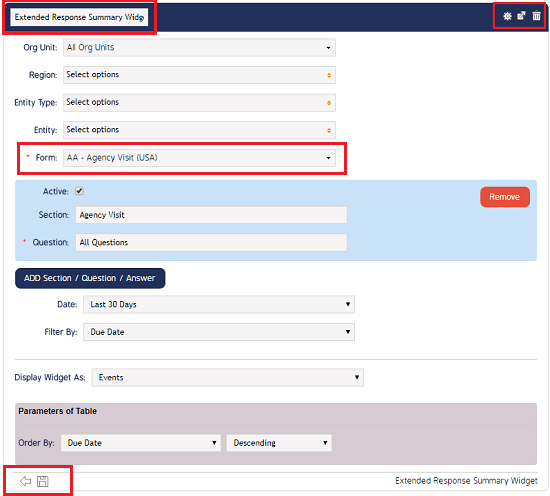
- The widget will appear but will display Event information. Click the cog wheel in the top right corner of the widget to add/edit information.
- Configure the respective information about the Form question/responses you want to display in the widget.
Note: Individual Form questions must be individually added to this widget. The following steps will need to be repeated for each Form question/response added to the widget. - Enter the respective information in the Org Unit, Region, Entity Type, Entity, and Form fields.
- Select a Section and Question to display, then click the ADD Section / Question / Answer button.
Note: Users must select a specific question in the *Question field. It cannot be left with the All Questions value.
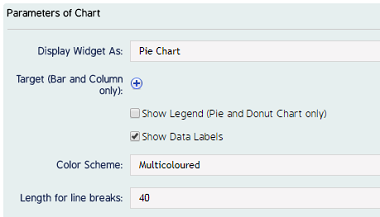
Parameters of the Chart
Use the Parameters of the Chart section to configure how the information will be displayed to users (pie chart, bar chart, color scheme, etc).
Choose a display using the Widget Display As drop-down menu.
For Bar and Column Charts use the +Target option to select a target and color. The targets will display as colored lines in the chart.