
TeamConnect Business Intelligence (TCBI) Usage Analytics
As of TeamConnect Business Intelligence version 7.0, clients can now request to access TCBI report usage analytics. The reports are generated by Sisense and are specific to the TCBI data cube.
Note:
- Data is accumulated once the feature is enabled and stored on your Sisense Server for a period of the last 30 days.
-
Mitratech does not provide support for customizing usage dashboards.
Overview of Usage Analytics
Sisense Usage Analytics helps you to understand how users are interacting with Sisense dashboards and optimize your dashboards accordingly. Sisense collects usage data for the following actions:
- Opening a dashboard
- Changing a filter
- Selecting areas (filter)
- Drilling down into widgets
- Exporting a dashboard to PDF
Sisense Usage Analytics includes the following dashboards:
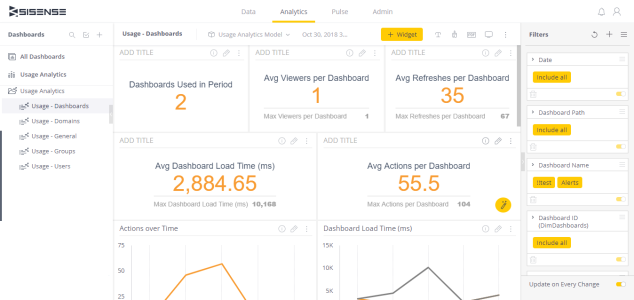
Usage - Dashboards: Provides insights regarding the number of dashboards in your system, how often they are used, and their performance.
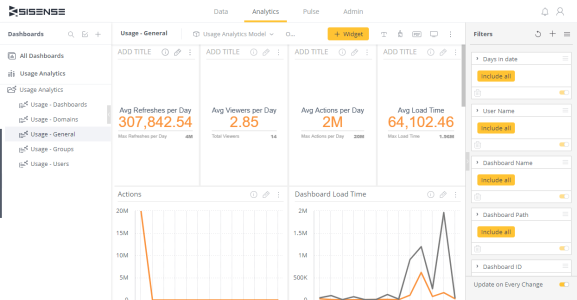
Usage - General: Provides a general summary of dashboard performance, dashboard usage, and who is viewing your dashboards.
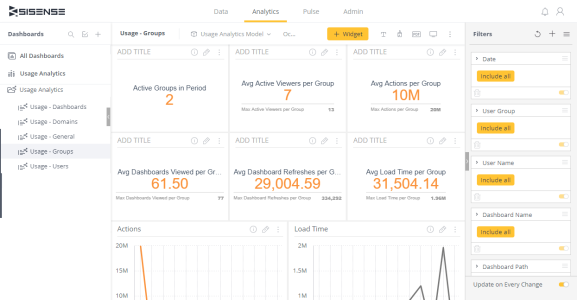
Usage - Groups: Provides insights regarding group activity in your system and their dashboard usage.
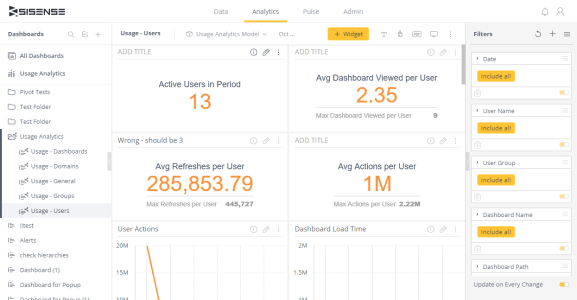
Usage - Users: Provides insights regarding the behavior of specific users in the system.
You have the ability to refine the data shown in your widgets by utilizing the filters located on the right side. These filters allow you to narrow down the specifics of your dashboard based on different criteria, like a particular dashboard, user, or group.
Note : Groups with ';' in their name will lead to incorrect data being displayed in your Usage Analytics as this causes the groups to be parsed as two separate groups.
Requesting Access to Usage Analytics Dashboards
Please submit a request via a ticket in the TeamConnect Communities Page. The Support team will work with you to enable the analytics cube and share the dashboards. Please note that it may take up to a week for this process to be completed.