
Better Handling of Cartesian Products
New settings are introduced to TCBI v6.2.4 and above versions that can handle M2M relationships which improves query performance.
On configuring these settings if a user performs a bad query, a Query Error window pops-up to prevent the query consuming all the memory available on the server. It is recommended to the user to revisit the requested query and modify it to a less memory intensive report.
M2M Configuration Parameters
The configuration files can be found at the following locations:
-
C:\ProgramData\Sisense\PrismServer\AbacusConf\abacus.conf.1
-
C:\ProgramData\Sisense\PrismServer\AbacusConf\abacus_r.conf.1
Note:
- The both configuration files have the same default parameters to be defined and it’s recommended to update both files if you do need to change the parameters.
- Users correspondingly need to Stop/Start eCube before/after updating the configuration files.
The following are the default values for M2M configuration parameters:
-
m2m_detect_build_result_increase_percent=10000
-
m2m_detect_build_result_increase_size=2000000000
-
m2m_detect_error_result_increase_percent=2000
-
m2m_detect_error_result_increase_size=500000000
-
m2m_detect_warning_result_increase_percent=500
-
m2m_detect_warning_result_increase_size=100000000
-
m2m_detect_sample_power_2_interval=20
-
m2m_minimum_estimate_value=2000000000
Note: Users can customize the M2M configuration parameters based on their datasets.
m2m_detect_sample_power_2_interval
This parameter provides the interval value at which M2M thresholds are checked. This check happens at each interval to identify whether the data has reached the threshold value.
The default value of 20 implies 2^20 = 1,048,576 (i.e.) number of rows before M2M thresholds are checked.
For example, the first check happens when the number of rows reach 1,048,576 and the second check happens when the number of rows reach - 2* 1,048,576 = 2,097,152. It will continue the check every interval until either the result is completed successfully or the result has reached the threshold.
To turn off the M2M detector, set the value to Zero(0).
m2m_detect_warning_result_increase_percent
This parameter gives the minimum percentage of the size of the largest table in the query could grow before the warning page is thrown.
m2m_detect_warning_result_increase_size
This parameter gives the minimum size of the result of a query could reach before the warning page is thrown.
m2m_detect_error_result_increase_percent
This parameter gives the minimum percentage of the size of the largest table in the query could grow before the error page is thrown.
m2m_detect_error_result_increase_size
This parameter gives the minimum size of the result of a query could reach before the error page is thrown.
m2m_detect_build_result_increase_percent
This parameter gives the minimum percentage of the size of the largest table in the custom sql query that could grow before the eCube build is giving a warning.
m2m_detect_build_result_increase_size
This parameter gives the minimum size of the result of a custom sql query could grow before the eCube build is giving a warning.
Note: Builds are not aborted when M2M is detected - the build threshold is only used for aborting queries associated with viewing a custom table.
M2M Threshold Formula
Formula to calculate the threshold is:
Threshold = Largest table number of rows + max (Percentage of largest table, Amount of rows)
Example:
Consider the scenario of a widget displaying data associated with a join on 2 tables inducing a M2M abnormal query consumption warning.
The value of Table 1 = 100M rows; Table 2 = 500K rows;
m2m_detect_warning_result_increase_percent=500 (x5)
m2m_detect_warning_result_increase_size=100000000
M2M Warning Threshold = 100M + Max(5*100M, 100M) = 600M
Therefore, in this scenario the calculated m2m_detect_warning_result_increase_percent Threshold of 600M rows will be used to trigger the abort query/warning.
Warning v/s Error Threshold
Warning threshold is calculated based on the following parameters:
-
m2m_detect_warning_result_increase_percent
-
m2m_detect_warning_result_increase_size
And, Error threshold is calculated based on the following parameters:
-
m2m_detect_error_result_increase_percent
-
m2m_detect_error_result_increase_size
Query Error window pops up if the user performs the query reaching the 1st threshold/Warning threshold limit.
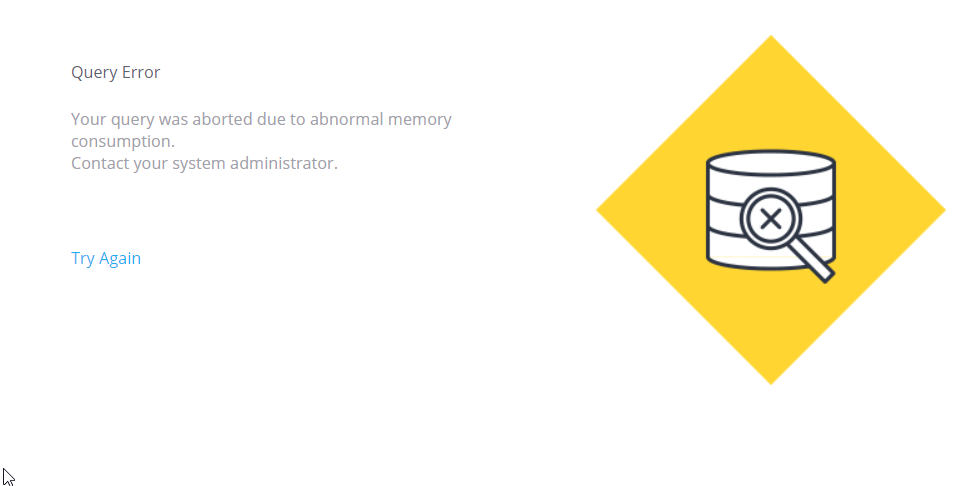
If the user clicks the Try Again option, it will try to run the query and display the widget result but unfortunately if the consumption of resources goes high and if it reaches 2nd threshold/Error threshold it will abort the query as shown above.
User can identify the difference between which threshold is being used on the basis of jaql query:
- If the Jaql query shows the following m2mThresholdFlag: 0 - it means the warning threshold is used.
- If the Jaql query shows the following m2mThresholdFlag: 1 - it means the error threshold is used.
Single Core vs. Multi Cores Behaviour
Scenario with Single Query/Core
Assume that EC is set up to a single query/core and there are 100M rows in the join.
-
If m2m_detect_sample_power_2_interval=20 then M2M detector will check thresholds at 100M + 2^20 rows (101,048,576).
-
If a threshold limit is reached - it will abort the query and give yellow diamond (triggered "warning").
Scenario with Multiple Queries/Core
Assume that EC is set up as a multi core and M2M detector is influenced by the parallel nature (mitosis) of using multiple threads per a query execution (cores).
-
In this scenario, the M2M detector does not work completely as expected (see single scenario example). Mitosis does not expose every query as a whole, since it is split across 4 threads.
-
M2M detector will abort the query if at least one of the threads reaches the threshold limit.
-
4 cores/queries may reach 400M rows (in total), before one of those query threads reaches the 1,048,576 rows threshold checking point.
-
Whichever core/query thread reaches 100M + 1,048,576 rows first will cause the query to abort.
Example In Detail:
The table below provides some examples of permutation and combination for M2M scenarios of customized values:
Given the following parameters:
-
m2m_detect_warning_result_increase_percent = 300 (x3)
-
m2m_detect_warning_result_increase_size = 10M
-
m2m_detect_error_result_increase_percent=500 (x5)
-
m2m_detect_error_result_increase_size=40M
-
m2m_detect_sample_power_2_interval=18
When joining 5M and 1M rows tables, the expected behavior is as follow:
-
Warning Threshold = 5M + max(5M X 3, 10M) = 20M
-
Error Threshold = 5M + max(5M X 5, 40M) = 45M
-
The table joins will hit both warning and error threshold; thus, the error page will always be displayed.
When joining 5M and 5 rows tables, the expected behavior is as follow:
-
Warning Threshold = 5M + max(5M X 3, 10M) = 20M
-
Error Threshold = 5M + max(5M X 5, 40M) = 45M
-
The warning threshold will be reached but when the user clicks on Try Again, the second try will give a successful return of the query.
The following is the iterations that we tested in our test environment to confirm the behaviors:
| P_TABLE1(Rowcount) | P_TABLE2(Rowcount) | Join-output | Warning-value | Thresholds | Comments |
|---|---|---|---|---|---|
| 1K | 500 |
|
10M |
Warning Threshold=10M Error Threshold=40M |
Query has not reached the warning threshold limit. No Warning message is displayed. |
| 1M | 1000 |
|
10M |
Warning Threshold=11M Error Threshold=41M |
Query has not reached the warning threshold limit. No Warning message is displayed |
| 1M | 1200 |
|
10M |
Warning Threshold=11M Error Threshold=41M |
Query has reached the warning threshold limit. Warning message is displayed. If user click Try Again to run the query, same Warning message will be displayed if it reach the Error threshold value. |
| 5M | 450 |
|
10M |
Warning Threshold=20M Error Threshold=45M |
Query has reached the warning threshold limit. Warning message is displayed. If user click Try Again to run the query, same Warning message will be displayed if it reach the Error threshold value. |
| 7M | 450 |
|
10M |
Warning Threshold=28M Error Threshold=47M |
Query has reached the warning threshold limit. Warning message is displayed. If user click Try Again to run the query, same Warning message will be displayed if it reach the Error threshold value. |


