PlatoBI Matter & Spend Dashboard
Overview
The Matter & Spend Dashboard for eCounsel provides insights and trends about invoice processing and matter status. The dashboard is powered by PlatoBI. Users can apply 11 different filters to slice all matter and invoice data to drive valuable analysis. The dashboard is embedded inside eCounsel for easy access where data will adhere to eCounsel matter security. Users can also export data as needed for downstream consumption.
All data displayed is dependent on user restrictions established within the eCounsel tool. Users will only be able to see matter and invoice data they have access to view. This may affect summary counts and totals displayed.
Page Controls
If you click on the top right side of each widget, you will see the additional controls for each widget.
|
Control |
Actions |
|
|
Maximize the widget. Note: Apply any desired filters before maximizing the widget. |
|
|
Minimize the widget and go back to the main view. |
|
|
Menu options: View summary data or export data to Excel or to a CSV file. Note: Export as CSV is recommended. |
|
|
Indicates if the KPI has filters applied. |
Homepage
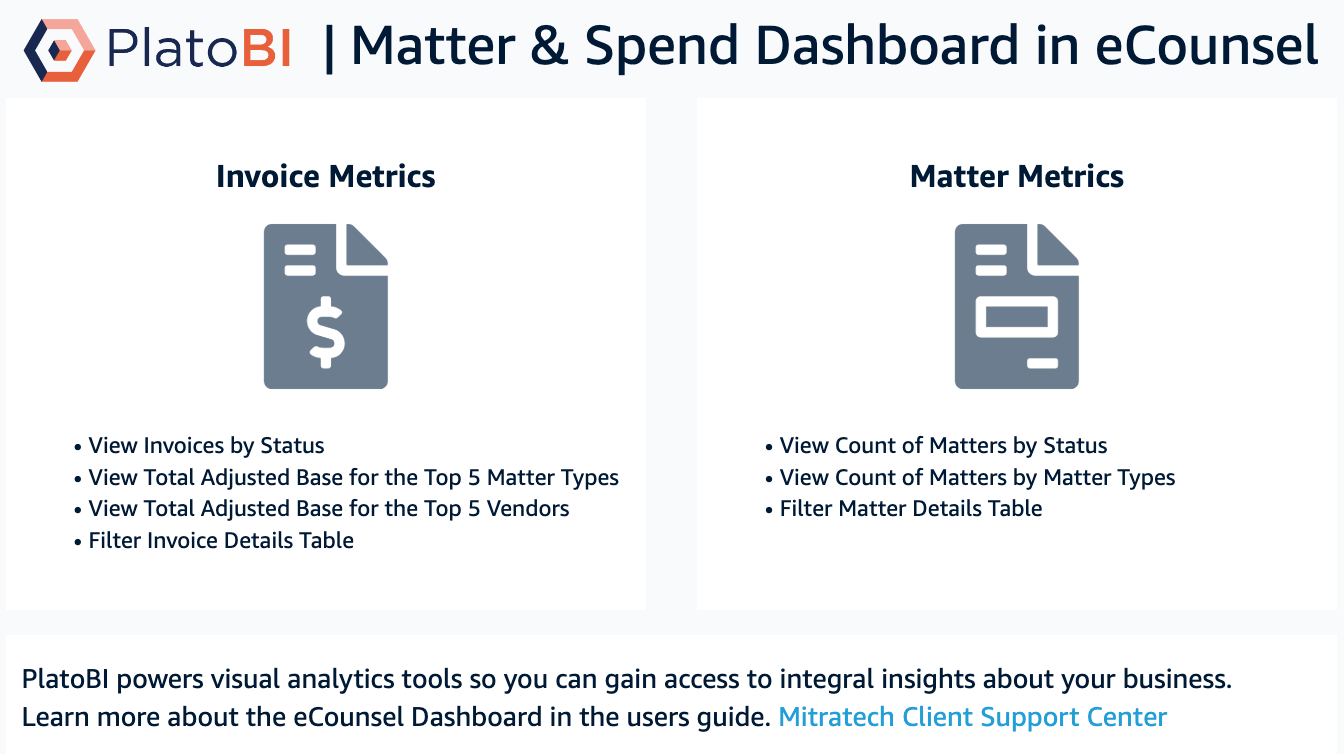
The eCounsel Dashboard contains a homepage with links to the Invoice Metrics and the Matter Metrics tabs. Click on the icons to navigate between tabs.
Invoice Metrics
This tab displays both summary data about invoices and a detailed data table at the bottom. These widgets will provide information on invoice status and spend.
Invoice Metrics Data Filters
Controls at the top of the page will allow the user to filter data displayed. To use these filters, first click on the control bar. Then adjust the desired filter by making a selection from the filter dropdown menu. The control bar can be minimized by clicking the arrow in the top right corner.
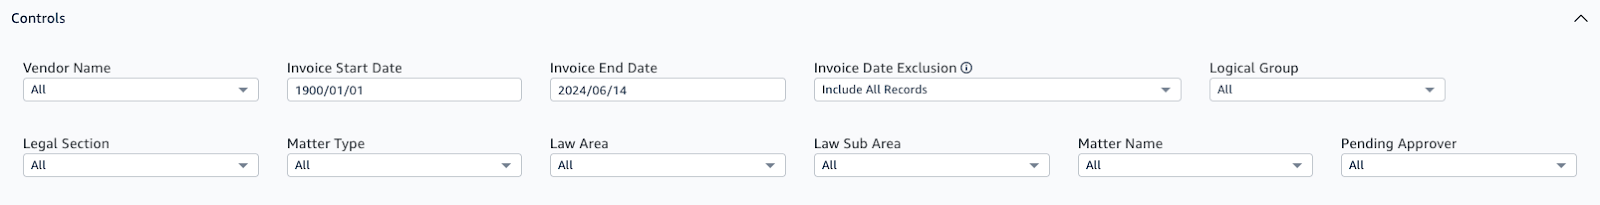
The following filters are available on this tab:
Vendor Name
Invoice Start Date
Invoice End Date
Invoice Date Exclusion (use this filter to include or exclude records without an invoice date)
Logical Group
Legal Section
Matter Type
Law Area
Law Sub Area
Matter Name
Pending Approver
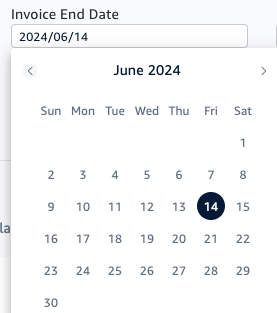
The Invoice Start Date and Invoice End Date filters let you choose a date from a calendar or key in a desired date. The start date count starts in 1900 to include all possible records. To enter a date through a selection on the calendar:
-
Click the Start Date filter or End Date filter box.
-
Use the < and > buttons to navigate through the months.
-
Click the day of the month.
You can reset a filter control by clicking on the three-dots icon that appears next to the drop-down list.
To reset all values in the dashboard, click on the round arrow on the top left corner of the dashboard.
Invoice Metrics Widgets
The Invoice Metrics tab includes the following widgets:
Invoices by Status
Total Adjusted Base by Matter Type
Total Adjusted Base by Vendor
Invoice Details
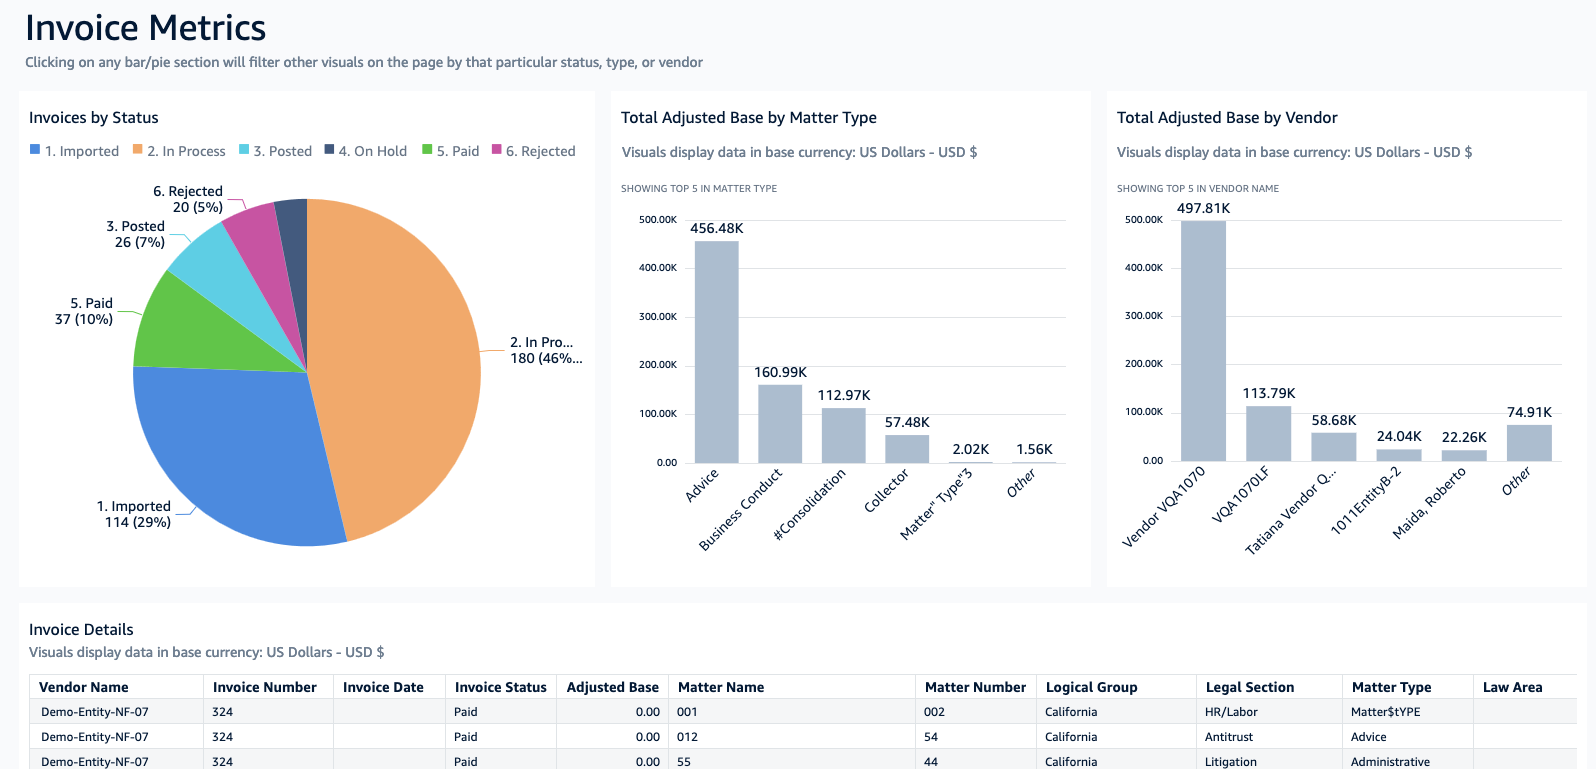
Invoices by Status
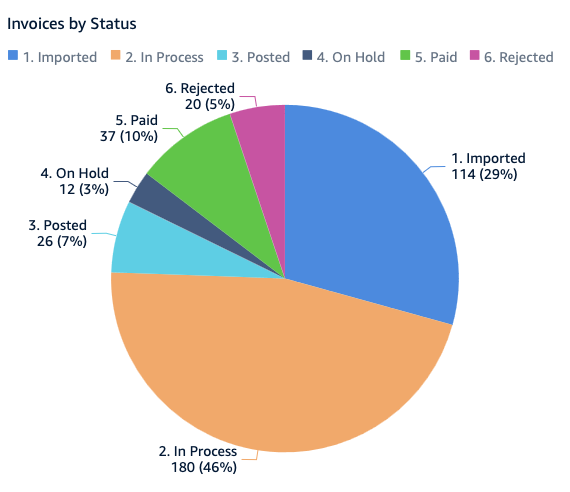
This pie chart displays the count and percentage of invoices by status. The default statuses displayed are:
-
Imported
-
In Process
-
Posted
-
On Hold
-
Paid
-
Rejected
One-Click Interactive Filter: Use the pie chart to filter other widgets
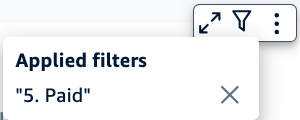
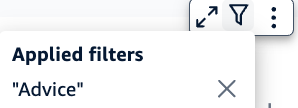
The user can click on a pie segment to filter the Total Adjusted Base by Matter Type, Total Adjusted Base by Vendor, and Invoice Details widgets by the selected invoice status. After clicking on a invoice status in the pie chart, the filter icon appears on all other widgets. Click the filter icon to show the invoice status being applied as a filter. Click on the X to clear the invoice status filter being applied. See How to Use One-Click Interactive Filters in the KPIs for more information.
For example, the applied filter corresponds to status 5. Paid. Clicking on the X will clear this filter.
Total Adjusted Base by Matter Type
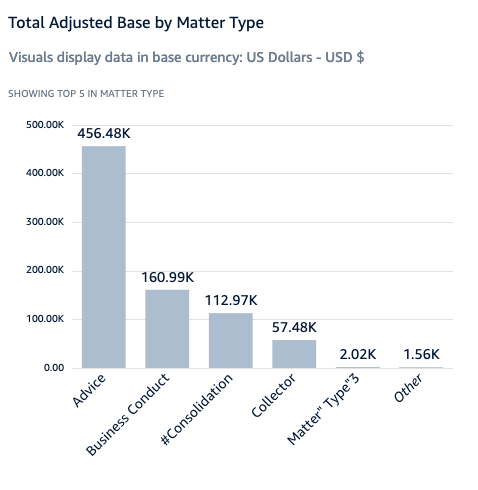
This bar chart displays the top five matter types that contributed the most to spend or the total adjusted base. The sixth bar groups the remaining matter types as Other. The currency displayed matches the default currency set in eCounsel. Users can hover their cursor over a bar to show the matter type and the exact adjusted base (spend).
One-Click Interactive Filter: Use the bar chart to filter other widgets
The user can click on a bar to filter Invoices by Status, Total Adjusted Base by Vendor, and Invoice Details widgets by a particular matter type. After clicking on a bar, the filter icon appears on all other widgets. Click the filter icon to show the matter type being applied as a filter. Click on the X to clear the matter type filter being applied. See How to Use One-Click Interactive Filters in the KPIs for more information.
Total Adjusted Base by Vendor
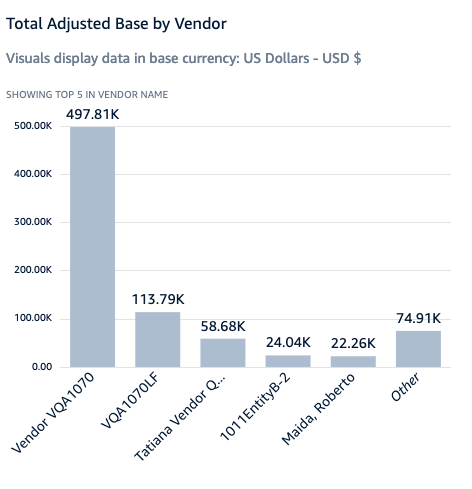
This bar chart displays the top five vendors that contributed the most to spend or the total adjusted base. The sixth bar groups the remaining vendors as Other. The currency displayed matches the default currency set in eCounsel. Users can hover their cursor over a bar to show the vendor name and the exact adjusted base (spend).
One-Click Interactive Filter: Use the bar chart to filter other widgets
The user can click on a bar to filter Invoices by Status, Total Adjusted Base by Matter Type, and Invoice Details by a particular vendor. After clicking on a bar, the filter icon appears on all the other widgets. Click the filter icon to show the vendor being applied as a filter. Click on the X to clear the vendor filter being applied. See How to Use One-Click Interactive Filters in the KPIs for more information.
Invoice Details
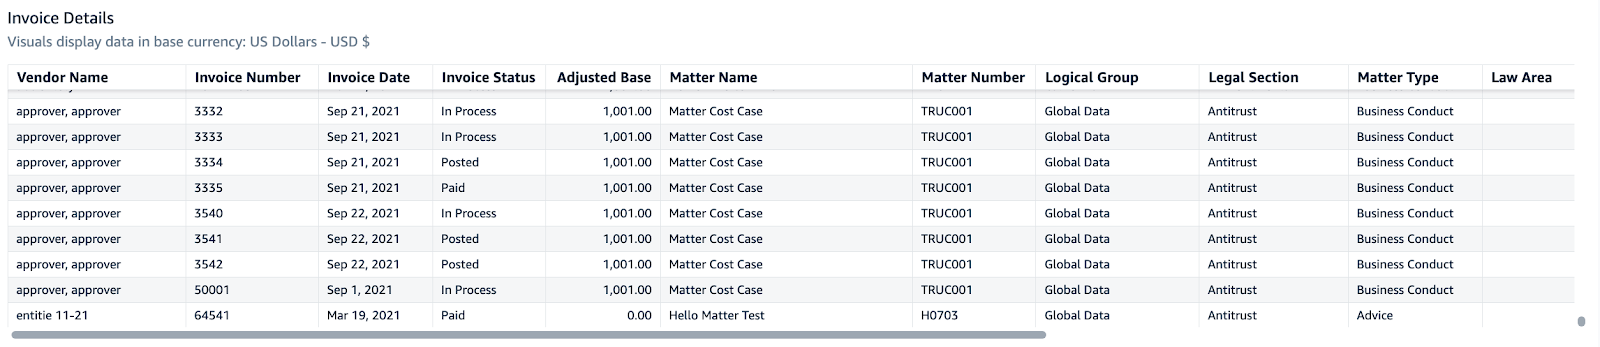
This table displays detailed information about invoice records. The side and bottom scrollbars will allow the user to navigate the entire length and width of the Invoice Details table. Columns included in the table widget are:
-
Vendor Name
-
Invoice Number
-
Invoice Date
-
Invoice Status
-
Adjusted Base (currency displayed matches the default currency set in eCounsel)
-
Matter Name
-
Matter Number
-
Logical Group
-
Legal Section
-
Matter Type
-
Law Area
-
Law Sub Area
-
Paid Date
-
Pending Approvers (Days) (This field refers to the person assigned to approve the invoice payment. Days refers to the number of days since approval was requested. Note that not all invoices contain days or approver information and that days since the approval request are counted even after the invoice has been paid.)
Note: Because an Invoice might be tied to multiple matter names, the user may see multiple records in the Invoice Details table even when one single invoice has been isolated through the various dashboard filters available.
Matter Metrics
This tab displays both summary data about matters and a detailed data table at the bottom. These widgets will provide information on matters status and matter type.
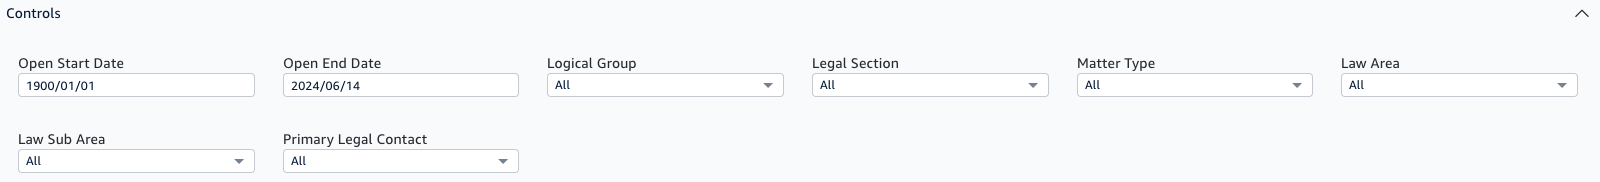
Matter Metrics Data Filters
Controls at the top of the page will allow the user to filter data displayed. To use these filters, first click on the control bar. Then adjust the desired filter by making a selection from the filter dropdown menu. The control bar can be minimized by clicking the arrow in the top right corner.
The following filters are available on this tab:
Open Start Date
Open End Date
Logical Group
Legal Section
Matter Type
Law Area
Law Sub Area
Primary Legal Contact
The Open Start Date and Open End Date filters let you choose a date from a calendar or key in a desired date. The start date count starts in 1900 to include all possible records. To enter a date through a selection on the calendar:
-
Click the Start Date filter or End Date filter box.
-
Use the < and > buttons to navigate through the months.
-
Click the day of the month.
You can reset a filter control by clicking on the three-dots icon that appears next to the drop-down list.
To reset all values in the dashboard, click on the round arrow on the top left corner of the dashboard.
Matter Metrics Widgets
The Matter Metrics tab includes the following widgets:
Matters by Status
Top 5 Matter Types
Matter Details
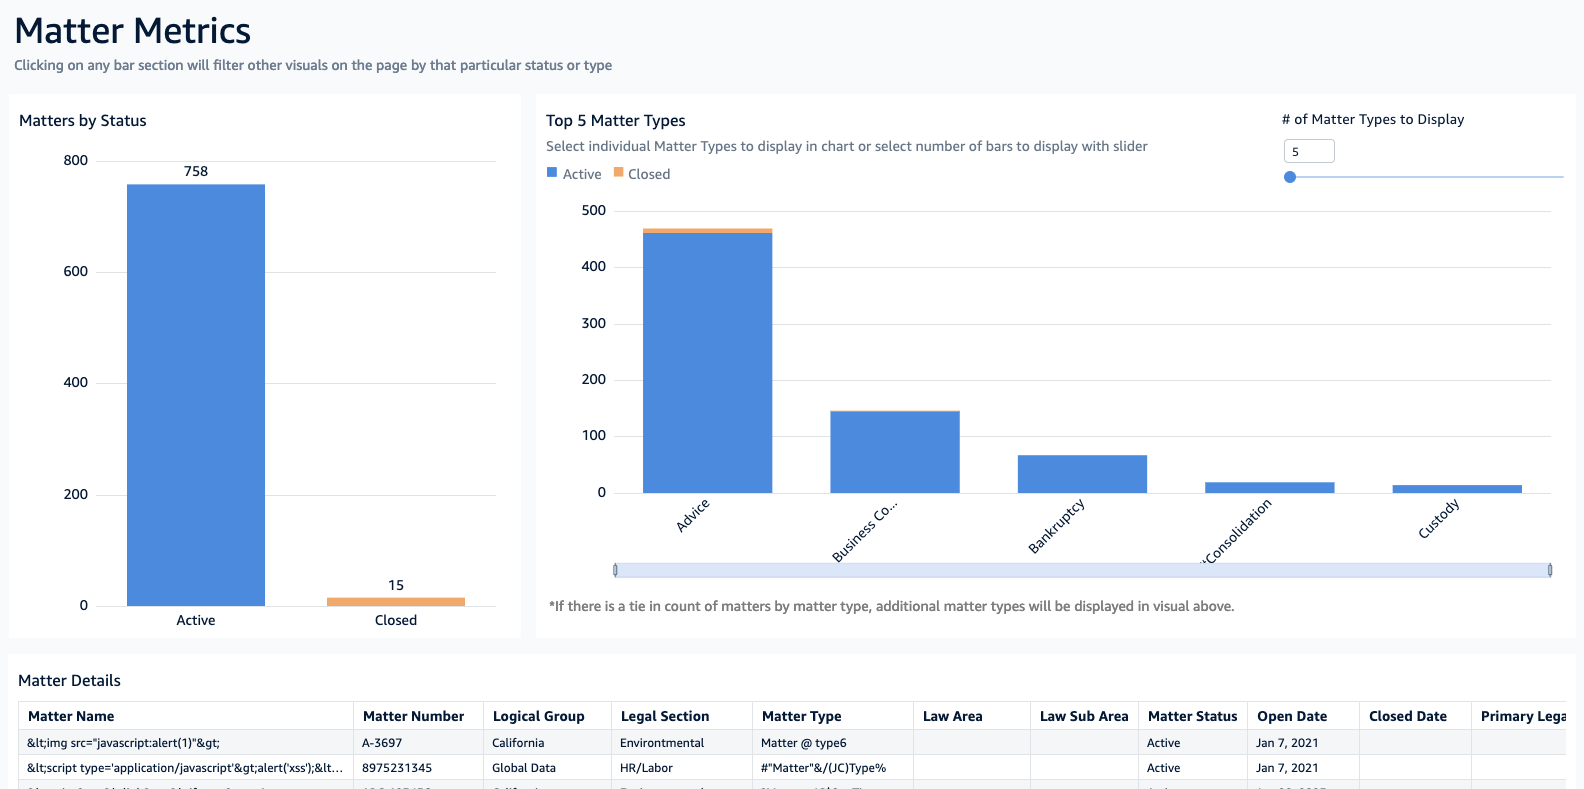
Matters by Status
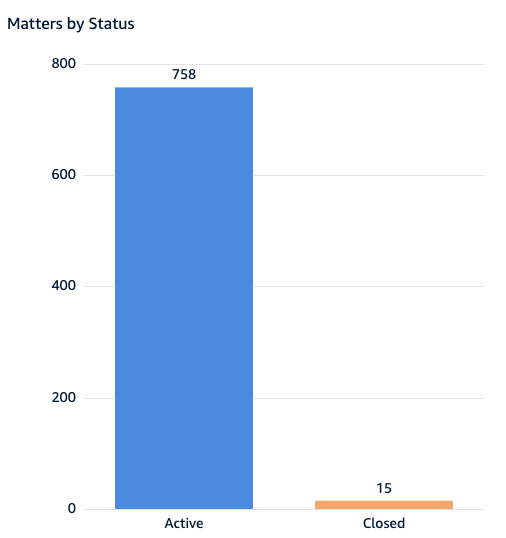
This bar chart displays the count of matters by status. Default status values are Active and Closed.
One-Click Interactive Filter: Use the bar chart to filter other widgets
The user can click on a bar to filter Top 5 Matter Types and Matter Details widgets by the selected matter status. After clicking on a matter status in the bar chart, the filter icon appears on all other widgets. Click the filter icon to show the matter status being applied as a filter. Click on the X to clear the matter status filter being applied. See How to Use One-Click Interactive Filters in the KPIs for more information.
Top 5 Matter Types
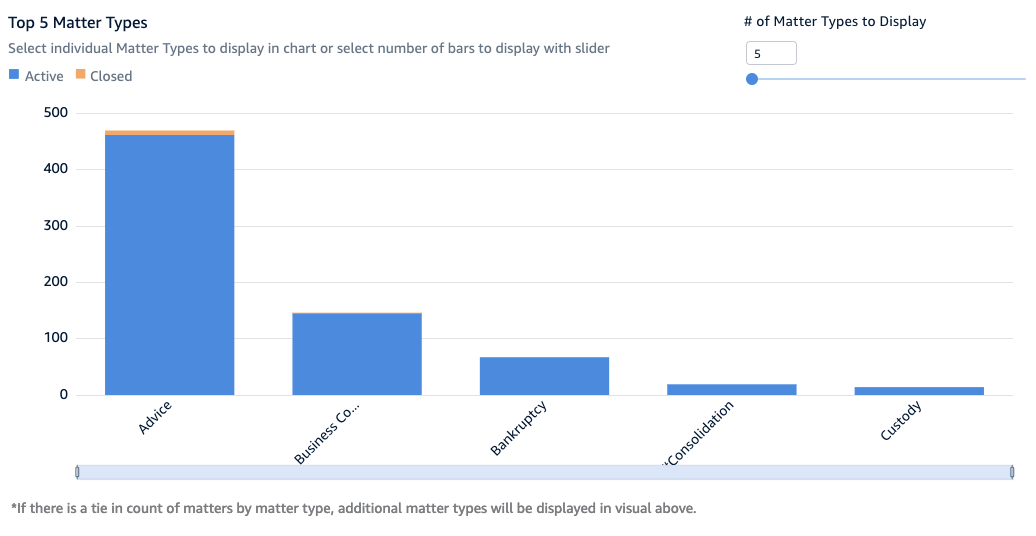
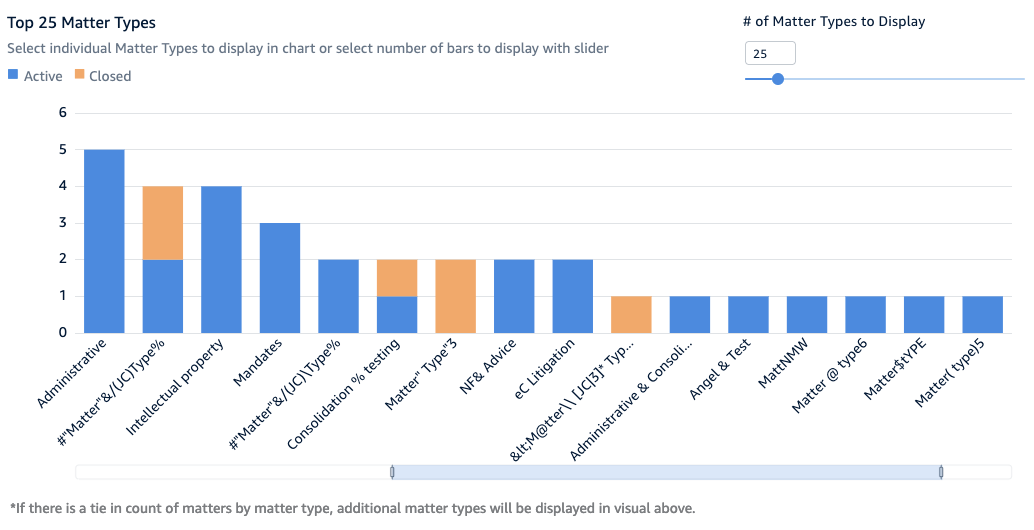
This stacked bar chart displays the count of matters by matter type. Active matters are represented in the blue segment of the bar and Closed matters are represented in the orange segment of the bar. Users can hover their cursor just above a bar to show the matter status, number of matters belonging to the matter status, and active and closed matter count as percentages.
The number of matter types displayed in this stacked bar chart is initially set to 5, but can be adjusted with the slider in the top right corner of the visual.
Note: If there is a tie in the count of matters by matter type, additional matter types will be displayed in the widget to note the tie value.
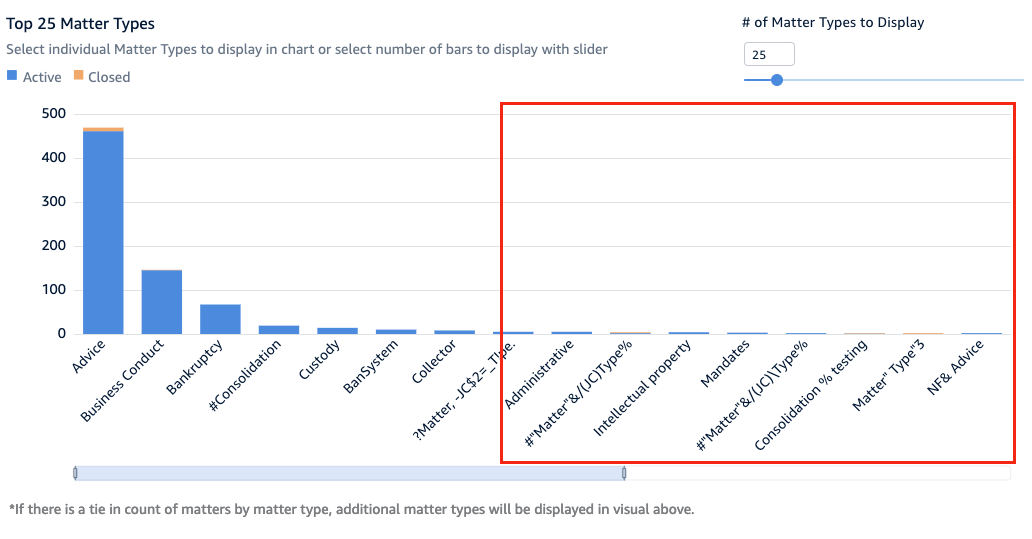
Using the Zoom Bar:
If the user has selected a large number of matter types to display in the widget, they may want to use the zoom bar to zoom in on a segment of the bar chart. This can be done by clicking on an edge of the light blue bar below the widget and dragging and dropping the bar to have a shorter length. This light blue bar can then be used as a scroll bar to scroll across the data and focus on a specific portion of the display. The y-axis for the widget will automatically adjust to fit the bars being displayed as a user scrolls through.
Bars in this widget are displayed high to low by count of matters in that matter type. Sometimes there is a great variance in values represented by bars on the left side of the widget and right side of the widget. This variance might make it difficult to determine the difference between shorter bars displayed. Using the zoom bar can allow users to better explore the differences between shorter bars. The example below shows how users can better investigate the data highlighted in the red box by using the zoom bar.
One-Click Interactive Filter: Use the bar chart to filter other widgets
The user can click on a bar to filter Matters by Status and Matter Details widgets by the selected matter type. After clicking on a matter status in the bar chart, the filter icon appears on all other widgets. Click the filter icon to show the matter status being applied as a filter. Click on the X to clear the matter status filter being applied. See How to Use One-Click Interactive Filters in the KPIs for more information.
Matter Details
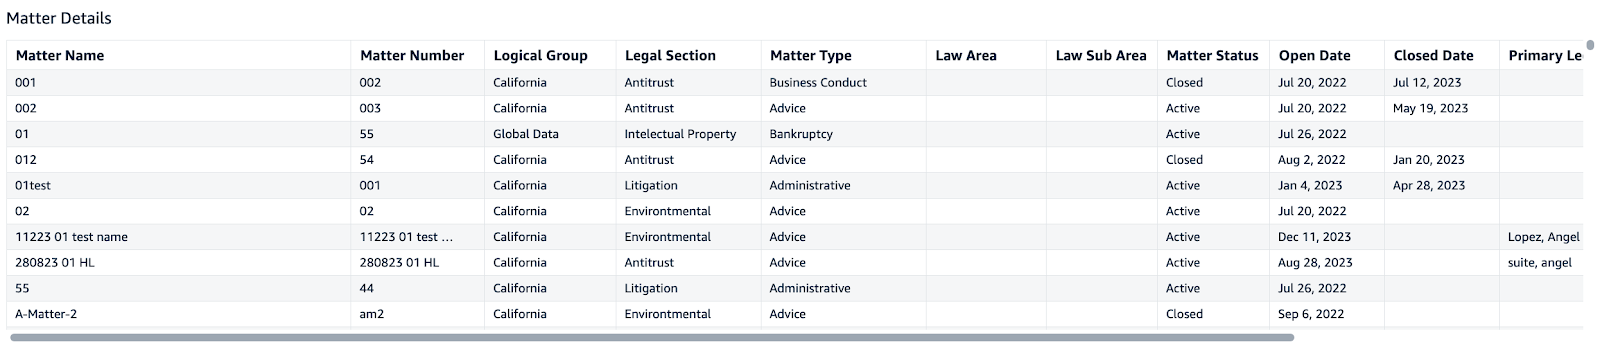
This table displays detailed information about matter records. The side and bottom scrollbars will allow the user to navigate the entire length and width of the Matter Details table. Columns included in the table widget are:
-
Matter Name
-
Matter Number
-
Logical Group
-
Legal Section
-
Matter Type
-
Law Area
-
Law Sub Area
-
Matter Status
-
Open Date
-
Closed Date
-
Primary Legal Contacts
How to Use One-Click Interactive Filters in the KPIs
The Matter & Spend Dashboard lets you filter the dashboard by clicking elements within some widgets, such as a pie section or a bar within the chart. The following table explains how to use the one-click interactive filters.
|
Tab |
Widget |
Action |
Result |
|
Invoice Metrics |
Invoices by Status |
Click on a pie segment |
Total Adjusted Base by Matter Type, Total Adjusted Base by Vendor, and Invoice Details filtered by invoice status |
|
Invoice Metrics |
Total Adjusted Base by Matter Type |
Click on a bar |
Invoices by Status, Total Adjusted Base by Vendor, and Invoice Details filtered by matter type |
|
Invoice Metrics |
Total Adjusted Base by Vendor |
Click on a bar |
Invoices by Status, Total Adjusted Base by Matter Type, and Invoice Details filtered by vendor |
|
Matter Metrics |
Matters by Status |
Click on a bar |
Top 5 Matter Types and Matter Details filtered by matter status |
|
Matter Metrics |
Top 5 Matter Types |
Click on a bar |
Matters by Status and Matter Details filtered by matter type |
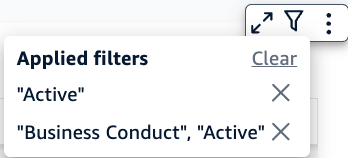
To clear a filter, click on the X next to the applied filter.
To clear all filters on the tab, click Clear.