Charts
The Charts menu on the main menu includes any charting modules that have been purchased for your installation. The Risk Dashboard is provided with all systems.
Risk Dashboard
The Risk Dashboard provides insight into the effectiveness of OpRiskControl and the Risk management effort enterprise wide. The dashboard contains four areas of information:
- Risk counts.
- Action/Action counts.
- Current top Risks.
- Risk matrix.
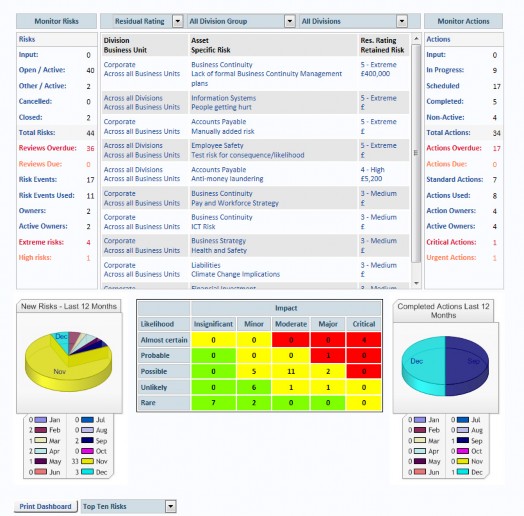
The Dashboard normally shows Risks, counts and statistics for the whole enterprise, but it can be filtered by Division or Division Group.
The Monitor Risks section on the left shows Risk counts and the Monitor Actions section (which includes controls and Actions) on the right shows Action statistics. The explanation of these counts follows.
Monitor Risks
- Input - Risks that have been entered but not formally accepted into the system.
- Open/Active – Risks that are currently active.
- Other/Active – Risks which have been assigned non-system status codes are listed here.
- Cancelled – Risks that may not now be required (e.g. duplicate Risk).
- Closed – Risks that do not exist now.
- Total Risks – Risks that exist in the system regardless of status.
- Reviews Overdue – Risks where the review date has passed.
- Reviews Due – Risks where the review date is approaching (within the time band configured in System Settings).
- Risk Events – Potential Risk Events set up in the system.
- Risk Events Used – The number of Risk Events that have associated Risks.
- Owners – The number of people (and/or roles) that own Risks.
- Active Owners – The number of people (and/or roles) that own Risks that are currently open/active.
- Extreme Risks – The number of Risks that are currently rated at the highest level.
- High Risks – The number of Risks that are currently rated at the second highest level.
Monitor Actions
- Input – Actions associated with Risks that have not formally been accepted into the system.
- In Progress – Actions associated with Risks that are open/active and neither the Action
- Due Date nor the Action Date Completed has been entered.
- Scheduled – Actions which have been assigned a Due Date.
- Completed – Actions associated with Risks that are open/active and the Action Date Completed has been entered.
- Non-Active – Actions associated with Risks that are not open/active.
- Total Actions – Actions that exist in the system regardless of status.
- Actions Overdue – Actions where the due date has passed.
- Actions Due – Actions where the due date is approaching (within the time band set up in System Settings).
- Standard Actions – The number of Action Codes in the system.
- Action Used – The number of Action types which includes ad hoc Actions and standard mitigations set up in the system. The count may be more than Actions Available due to ad hoc Actions.
- Action Owners – The number of people (and/or roles) that own Actions.
- Active Owners – The numbers of people (and/or roles) that own Actions that are currently open/active.
- Critical Actions – The number of Actions that are associated with Risks that are currently rated at the highest level.
- Urgent Actions – The number of Actions that are associated with Risks that are currently rated at the second highest level.
Pie Charts
If your installation has a charting license then you will be able to see a small chart on either side of the Risk matrix as follows: The left chart will show Risks entered by month for the last 12 months and the right chart shows Actions completed by month for the last 12 months.
Enterprise Rating
At some high level places in the system such as the Dashboard and the Risk Matrix display, you have the option to view things by Assessed Rating (without the effect of any Action), Residual Rating (as rated in the business unit when one or more Actions have been completed) and Enterprise Rating (the rating that applies across the enterprise, and which may be lower than the business unit rating).
- Assessed Rating is determined by the intersection between Assessed Likelihood and Assessed Consequence.
- Residual Rating is determined by the intersection between Residual Likelihood and Residual Consequence.
- Enterprise Rating is determined by the intersection between Residual Likelihood and Enterprise Consequence. That is, Enterprise Rating still uses the Residual Likelihood but overrides the Residual Consequence with the Enterprise Consequence.
The Enterprise Consequence is determined by taking the Retained Risk (a monetary amount and being the Potential Loss in monetary terms reduced by the effectiveness of any Consequence Actions) and looking up the cut-off value in the Enterprise Rating table to see where it fits in the overall appetite for Risk for the enterprise.
To recap:
The formula for Assessed Rating is derived from the Assessed Likelihood and Assessed Consequence.
The formula for Residual Rating is derived from the Residual Likelihood and Residual Consequence.
The formula for Enterprise Rating is derived from the Residual Likelihood and Enterprise Consequence.
The Enterprise Consequence is derived from the Cut-off Value in the Enterprise Rating table. In other words, we are ignoring the allocated Assessed Consequence and the derived Residual Consequence. Instead, we are focusing on the potential monetary loss or, more correctly, the residual monetary loss, then looking up the monetary Cut-off Value in the Enterprise Rating table. This allows business units to rate Risks as they see them, but, at the highest level (the enterprise level), the consequence can be adjusted down as the residual loss may not be that important to the company overall.
Chart Wizard
The Chart Wizard selects the chart to be used with various information. There are chart criteria based on average values and chart criteria based on total values.
The Chart Wizard uses the same filter as the Risk Search except that only Open Risks are shown, and remembers selections from one program to the other. When the filter is changed, you need to click the Search button, and when that is done, the number of Open records is displayed on the right side of the form.
Chart options depend on the chart type. The toolbar above the chart allows you to customise the chart by selecting:
Chart Name – select the type of information displayed in the chart:
- Average Risk by: Asset Type, Asset/Area, Department, Division, Function, Location, Project, Risk Context, Risk Event, Risk Type.
- Highest Risk by: Asset Type, Asset/Area, Department, Division, Function, Location, Project, Risk Context, Risk Event, Risk Type.
- Individual Risks (use filter above).
- Number of Risks by: Asset Type, Asset/Area, Department, Division, Function, Location, Project, Risk Context, Risk Event, Risk Type.
- Total Risk by: Asset Type, Asset/Area, Department, Division, Function, Location, Project, Risk Context, Risk Event, Risk Type.
Chart Type – select the type of chart (Column, Bar or XY).
Display – select whether you want Assessed, Residual or Both (Assessed and Residual) Ratings displayed.
The toolbar below the chart allows you to manage the presentation, not the data that is displayed. You may change the palette, and, depending on the type of chart, select the sort sequence, or with X-Y charts, whether you would like a heat-map overlay.
Charts Based On Average Criteria
The data that feeds charts based on average criteria consists of average likelihood, average consequence and average rating before and after Action (Assessed and Residual) by Department, Division, Function/Area, Location, Risk Event, Risk Group and Risk Type. The chart types are bar, column and X-Y charts.
The bar and column charts are presented in three charts, one each for likelihood, consequence and rating, and may show assessed, residual and both sets of values as shown above. There are numerous permutations and the chart colour may be varied as well.
Note: Chart Wizard allows you to drag a chart from Chart Wizard and drop it into Microsoft Word or any other compatible software.

X-Y charts are often called Risk Maps and show the intersection of Likelihood and Consequence.
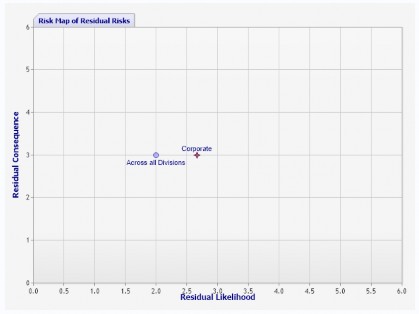
X-Y charts allow you to add a heat-map overlay by selecting Yes for the Overlay drop-down at the bottom of the page when an X-Y plot is displayed.

The overlay colours may be changed by your Database Administrator editing the colours in the database table tblOverlay. If the colours do not show in 3 shades as shown, the cause may be that you are using European decimal format, therefore ask your DBA to change the size columns from 0.5 to 0,5 (using the comma separator).

Charts Based On Total Criteria
The data that feeds charts based on total criteria consists of total Risk rating and potential loss (monetary value) before and after Action (Assessed and Residual) by Department, Division, Function/Area, Location, Risk Event, Risk Group and Risk Type. The chart types are bar, column and pie charts.
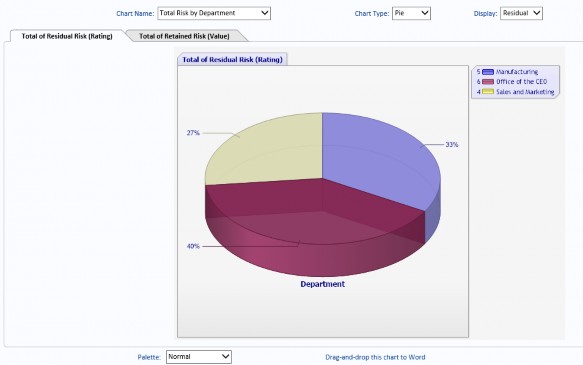
The pie charts may be presented in two charts, one each for Risk rating and potential loss, and may show assessed, residual and both sets of values as shown above.
Control Effectiveness
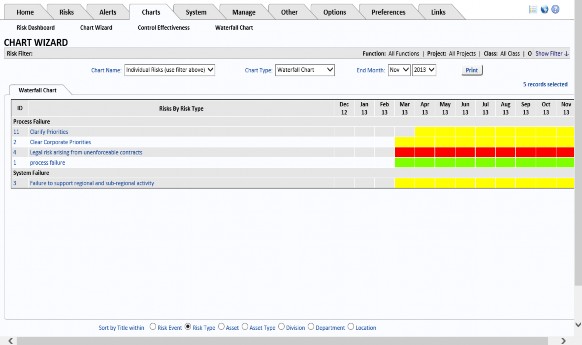
When you select Individual Risks (use filter above), you can chart the effectiveness of Actions.
You may group the report in any of six ways, and may optionally include the Control Effectiveness rating.
The user can click on any Risk in the chart to view that Risk.
Waterfall Chart
The Waterfall Chart shows when Risks were created and closed. It also shows the Risk Rating.