
Report Wizard
Introduction
Many Risk reports are provided. However, users can access the data via other report writers such as Crystal Reports.
It is imperative that the user does not employ any tool that is able to update data in the database as this might compromise the database integrity. All report tools must use read-only access.
You can display reports on the screen (rather than send them to a printer) and, where possible, drill-down. When you have displayed a report in the Report Wizard, and want to see more details of any Risk or Action listed in the report, you can click on the row to open up the form that manages the Risk or Action.
There are a number of ways to print reports. You can specify, select, view and print the list of Risks using the Report Wizard or from various points of the system. The Report Wizard contains reports based upon the Risks selected using the search screen.
Reports can also be exported by clicking on the Print or Export button. A drop down list provides the following export options:
- Acrobat (PDF file).
- CSV (comma delimited).
- Excel 97-2003 Workbook (.xls).
- Excel Workbook (.xlsx).
- Rich Text Format.
Risk Search And Display
Determine the data you want displayed on the screen via the search filter. Then decide which columns you want displayed on the screen via the search layouts. Finally, you can set the order you want the data displayed on the screen by clicking on the column headings.
After displaying the records, you can:
- Print as displayed (you may need to select landscape mode to fit all columns on the page).
- Print to a PDF driver (pseudo printer) so you can distribute the report to others in PDF format.
- Use the Report Wizard to get pre-formatted reports (recommended).
Report Wizard
After filtering your data, select Report Wizard and then select the report format.
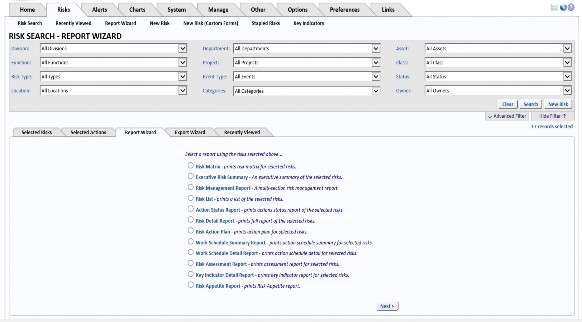
Report Wizard Overview
Most reports start with a page where you select the columns you want included and the order of the columns in the report.
The next page (if any) will normally allow you to enter a sort order. In some reports, you can also select how you want to group the report, but be careful that the grouping of a report will take more time to process and requires ample server memory. If the report is not displayed in about a minute, check with your IT support to make sure the server has at least 4 GB of memory.
Some reports that drill down to the Action level will also give you a third page where you can select the columns related to the Actions. Sorting and grouping is not available at this level.
When you get to the last page (just before printing) a System Administrator should see the following options on two reports (Executive Risk Summary Report and Action Status Report):
The Group by Risk button allows duplicate Risks to be hidden in the reports. The Group by Risk button is available in the last page of the Executive Risk Summary Report, the Action Status Report and the Risk Management Report.
If you have administrator privileges, you will see the Set Report Defaults button. This button makes the currently selected options the default options for the selected report.
The Back button takes you back one page.
The Report List button takes you back to the Report Wizard page.
If you have an active pop-up blocker on your browser and do not want to change it, ask your System Administrator to clear the option Show reports in new window in System Settings. Then all reports will be displayed in the same window rather than being displayed in a new window.
If you are grouping reports by Department and you want to append Department objectives to the Department name, ask the System Administrator to select the Ask to include Department objectives in reports grouped by Department option. You will then be given the option to select the option Append objectives to group name when grouping by Department.
When Print in landscape is selected, the printer will default to landscape mode. This option is not available on all Reports.
The Save Report Template button is displayed only if you have permissions to save the report for others to select and use. Only the Risk List Report has this option. See “Template Reporting”.
When Print criteria in header is selected, the report includes your selection criteria in the header of the report.
When this option is cleared, the criteria are not shown:
This is useful later when you are trying to remember how you filtered the report.
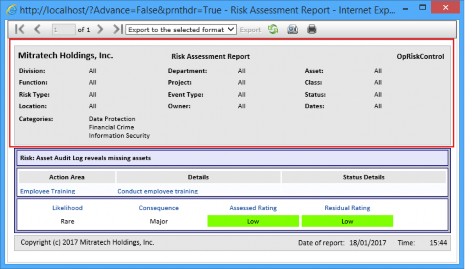
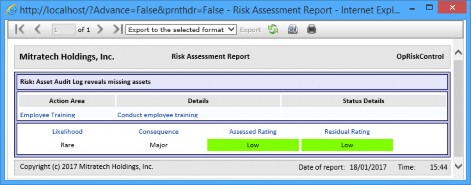
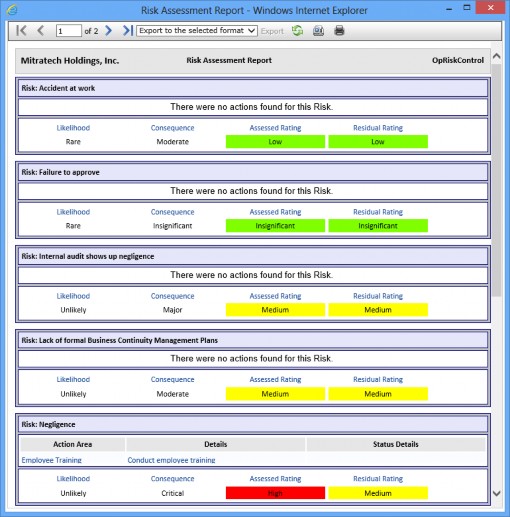
On some reports (for example the Risk Assessment Report), ratings are shown with colour and labels. If you want to suppress the rating labels in reports and just use colours, select Suppress Rating Labels in Reports (select the Preferences tab and then select Search Results).
Risk Assessment Report shown with Suppress Rating Labels in Reports cleared:
Risk Assessment Report shown with Suppress Rating Labels in Reports selected:

Risk Matrix
The Risk Matrix will be displayed for selected records (not necessarily for all records). It will exclude Risks that do not have a status of Open. You can select and show the matrix by assessed rating (without the effect of any Action), residual rating (as rated in the business unit) and enterprise rating (the rating that applies across the enterprise, and which may be lower than the business unit rating).
If your system is configured to show Consequences on the left of the Risk Matrix, then you will see a tick-box that you can enable to print the Consequence values with the Risk Matrix.
Be mindful that if you configure to show Consequences on the left of the Risk Matrix, the matrix will arrange (and look) differently to having Likelihood on the left of the matrix. When you click the Print or Export button, you see the Risk List.
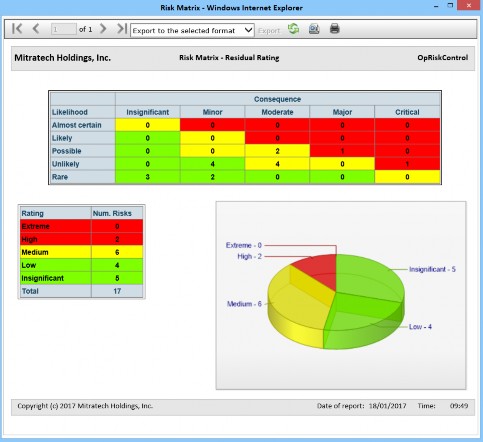
The Risk matrix is displayed with likelihood levels down the left and consequence levels across the top giving the Risk counts at the intersections. There is also a small table at bottom left giving the counts for each rating level, and a pie chart that gives the break-up visually.
If you run the Risk Matrix report by Enterprise Rating and get a lower count of total Risks than you do by Residual Rating, then the missing Risks have their Potential Loss set higher then the highest level of Cut-off Value configured for Enterprise Ratings. You will need to verify the potential loss values, and if correct you will need to increase the value of your highest rating level which is normally level 5 but may be level 4.
Executive Risk Summary Report
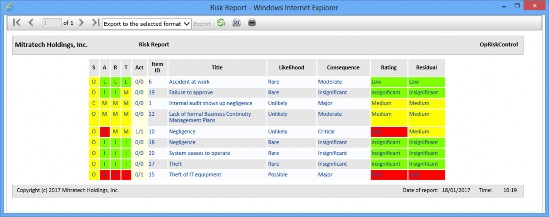
The Executive Risk Summary Report gives a quick snapshot of what requires attention. Anything in red needs immediate attention or is overdue.

This is the report most popular with senior executives.
Executive Risk Summary Selections
Select the Risk columns you wish to see on the left side of the Executive Risk Summary Report.
At this point you may determine the order (left to right) of the selected columns.
Then after selecting the report order, select the Action columns you wish to see on the right side of the report.
At this point you may determine the order (left to right) of the Action columns.
Risk Management Report
The Risk Management Report goes further than the Executive Risk Summary Report, giving a view of 5 areas to consider. You can run the report from any period up to the current date (for example, monthly, 6-weekly or quarterly) and it will show you:
- Section 1 - New Risks for period
- Section 2 - Continuing extreme or high Risks
- Section 3 - Former extreme of high Risks
- Section 4 - Risk Mitigation Report
- Section 5 - Risk Matrix
Risk List Report
Risk List Report is the quickest and easiest way to get a list of selected records. It allows you to select the columns in the printed list, the sort column and the sort order, and the number of Risks to print. By selecting the number of records to print, you will be able to print a top 10 Risk report by whichever sort column you desire.
Select the columns you wish to print, and the order (left to right) of the columns. Select the grouping and sort order in which you wish to print the information. When you click Print or Export you will see the following style of display.
The export options are in the drop-down list:
- Acrobat (PDF file)
- CSV (comma delimited)
- Excel 97-2003 Workbook (.xls)
- Excel Workbook (.xlsx)
- Rich Text Format
- Word Document
To get back to the menu system you will need to use the browser’s Back button.
Action Status Report
The Action Status Report has the same two forms as the Risk List Report to select the Risk columns, report grouping and sort order. In addition, a third form allows you to select the Action columns that will be seen on the report.
The report may look like this depending on the selections made.
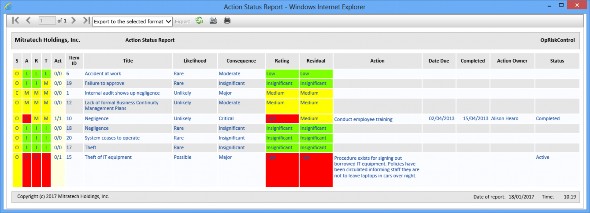
The Action Status Report has an option to print all Risks even if they do not have Actions.
The Action Status Report column settings are separate to the column settings for the Action List at the top of the Action data entry page.
Risk Detail Report
The Risk Detail Report will print all details for selected Risks. It allows you to select the sections of the report and the sort column, the sort order and the number of records to print.
By selecting the number of records to print, you will be able to print a detailed report of the top Risks sorted by whichever column you select.
Risk Action Plan
The Risk Action Plan will print summary information for selected Risks and the planned Actions for those Risks. It allows you to select the sort column, the sort order, and the number of Risks to print. This may be the best report to take to a management meeting when discussing budgets or Risk management activities.
By selecting the number of records to print, you will be able to print a Risk management plan for the top 10 Risks by whichever sort column you desire.
Work Schedule Reports
The Work Schedule reports will print summary or details of Actions for selected Risks. It allows you to select the Action sort column, the sort order and the number of records to print. This is the report that a workgroup manager would print to determine how to schedule Risk Actions.
As the Risks themselves can be filtered by Division, Department, Area/Function, Location and Risk Owner, and then the Actions can be sorted by Action Owner, Responsible Party, Due Date, Action Type, Action Method, a workgroup manager will have a powerful tool with which to schedule Risk Actions.
Note: Work Schedule reports provide data on Open Risks.

Risk Assessment Report
The Risk Assessment Report does not have any selection criteria. The intent of this report is to report on all selected Risks in alpha order, and next to each Risk the Action and Action details. If the description of the Action status has been entered, it will be shown as well.
Key Indicator Detail Report
The Key Indicator Detail Report displays information about the key indicators in the system. The report only displays Key Indicators which are linked to Risks and Controls.
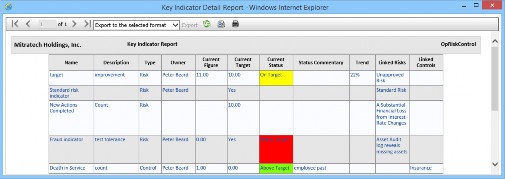
You can specify the visible columns that you want to appear in the report, and the column order.
Having selected the visible columns for the report, you can then define the report style by:
- Arranging the column positions.
- Sorting the direction of the columns.
- Selecting the heading display criteria.
- Printing in landscape or portrait orientation.
Risk Appetite Report
This report displays information relating to the Risk Appetite in Risk Events. By default, the report displays all data that is detailed in Risk Events. Refer to the System Administrators’ Guide for further details.
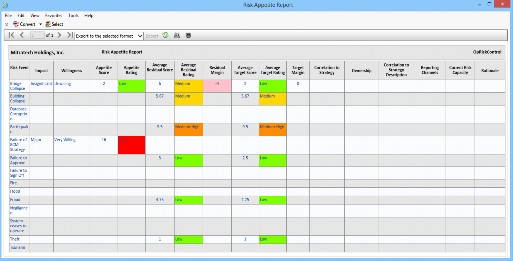
You can specify the visible columns that you want to appear in the report, and the column order.
Having selected the visible columns for the report, you can then define the report style by:
- Arranging the column positions.
- Sorting the direction of the columns.
- Selecting the heading display criteria.
- Printing in landscape or portrait orientation.
Template Reporting
If the user (normally the Risk Coordinator) has the appropriate permissions, they will be able to save the Risk List Report as a Report Template.
If the user clicks Save Report Template a dialog is opened and they can then name the report for later use. The report template may later be selected by any user.
There are multiple stages to producing a report, and they are:
- The report filter (what data to include).
- The report layout (report type).
- The report columns.
- The report grouping.
- The report sorting.
With OpRiskControl report templates, the only thing that can be changed by a user is the report filter. The rest of the report is fixed.
Export Wizard
Using the Export Wizard, you can export the Risk List to either Excel or XML format. You can also export the Risk Detail to XML format.
Risk List Export
This is similar to the Risk List Report, but exports the information to Excel or XML.
Risk Detail Export
This is similar to the Risk Detail Report, and exports the information to XML only.

Selected Actions
Whenever a search is performed for Risks, the Actions that relate to those Risks are available on the Selected Actions tab.
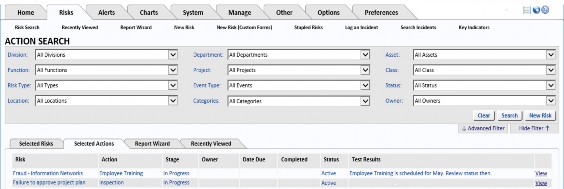
Likewise, if an advanced text search is performed for a keyword in Actions and the results are displayed on the Selected Actions tab, the Risks that relate to those Actions are available on the Selected Risks tab.