Charts
The Charts menu on the main menu includes any charting modules that have been purchased for your installation. The Incident Dashboard is provided with all systems.
Incident Dashboard
The Incident Dashboard provides insight into the effectiveness of the Incident management effort enterprise wide. The dashboard contains four areas of information:
- Incident counts.
- Action counts.
- Current top Incidents.
- Incident matrix.
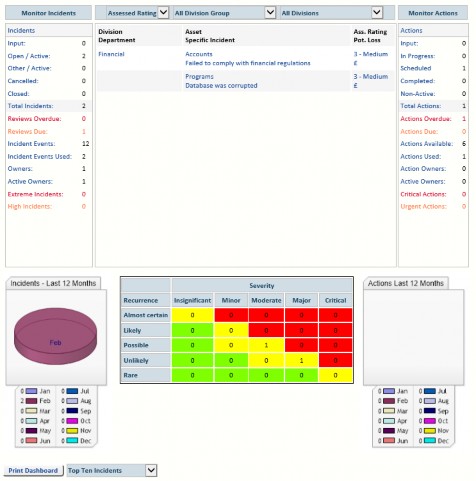
The Dashboard normally shows Incidents, counts and statistics for the whole enterprise, but it can be filtered by Division or Division Group.
The Monitor Incidents section on the left shows Incident counts and the Monitor Actions section (which includes controls and Actions) on the right shows Action statistics. The explanation of these counts follows.
Monitor Incidents
- Input – Incidents that have been entered but not formally accepted into the system.
- Open/Active – Incidents that are currently active.
- Other/Active – Incidents which have been assigned non-system status codes are listed here.
- Cancelled – Incidents that may not now be required (e.g. duplicate Incident).
- Closed – Incidents that do not exist now.
- Total Incidents – Incidents that exist in the system regardless of status.
- Reviews Overdue – Incidents where the review date has passed.
- Reviews Due – Incidents where the review date is approaching (within the time band configured in System Settings).
- Incident Events – Potential Incident Events set up in the system.
- Incident Events Used – The number of Incident Events that have associated Incidents.
- Owners – The number of people (and/or roles) that own Incidents.
- Active Owners – The number of people (and/or roles) that own Incidents that are currently open/active.
- Extreme Incidents – The number of Incidents that are currently rated at the highest level.
- High Incidents – The number of Incidents that are currently rated at the second highest level.
Monitor Actions
- Input – Actions associated with Incidents that have not formally been accepted into the system.
- In Progress – Actions associated with Incidents that are open/active and neither the Action Due Date nor the Action Date Completed has been entered.
- Scheduled – Actions which have been assigned a Due Date.
- Completed – Actions associated with Incidents that are open/active and the Action Date Completed has been entered.
- Non-Active – Actions associated with Incidents that are not open/active.
- Total Actions – Actions that exist in the system regardless of status.
- Actions Overdue – Actions where the due date has passed.
- Actions Due – Actions where the due date is approaching (within the time band set up in System Settings).
- Standard Actions – The number of Action Codes in the system.
- Action Used – The number of Action types which includes ad hoc Actions and standard mitigations set up in the system. The count may be more than Actions Available due to ad hoc Actions.
- Action Owners – The number of people (and/or roles) that own Actions.
- Active Owners – The numbers of people (and/or roles) that own Actions that are currently open/active.
- Critical Actions – The number of Actions that are associated with Incidents that are currently rated at the highest level.
- Urgent Actions – The number of Actions that are associated with Incidents that are currently rated at the second highest level.
Pie Charts
If your installation has a charting license then you will be able to see a small chart on either side of the Incident matrix as follows:
The left chart will show Incidents entered by month for the last 12 months and the right chart shows Actions completed by month for the last 12 months.
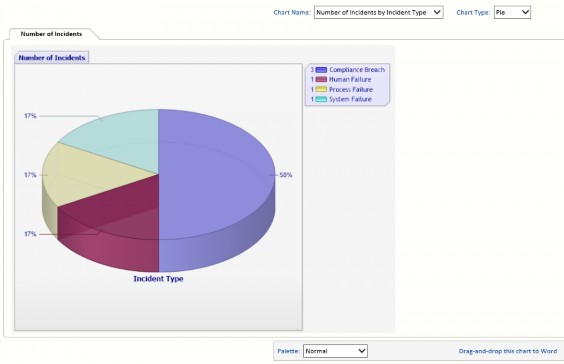
Chart Wizard
The Chart Wizard selects the chart to be used with various information. There are chart criteria based on average values and chart criteria based on total values.
The Chart Wizard uses the same filter as the Incident Search except that only Open Incidents are shown, and remembers selections from one program to the other. When the filter is changed, you need to click the Search button, and when that is done, the number of Open records is displayed on the right side of the form.
Chart options depend on the chart type. The toolbar above the chart allows you to customise the chart by selecting:
Chart Name – select the type of information displayed in the chart:
- Number of Incidents by:
- Asset/Area.
- Cause Code.
- Department.
- Division.
- Event Type.
- Function.
- Incident Group.
- Incident Type.
- Location.
- Project.
Chart Type – select the type of chart (Column, Bar or Pie).
The toolbar below the chart allows you to manage the presentation, not the data that is displayed. You may change the palette, and, depending on the type of chart, select the sort sequence.