Response Summary Widget Configuration
Create and configure the response summary widget.
The Response Summary widget displays responses from a single Form question. A good example of this might be the response of a daily inspection that must occur. The instructions below detail how to create and configure the Response Summary widget.
Response Summary Widget
- Log in and navigate to the Dashboard module.
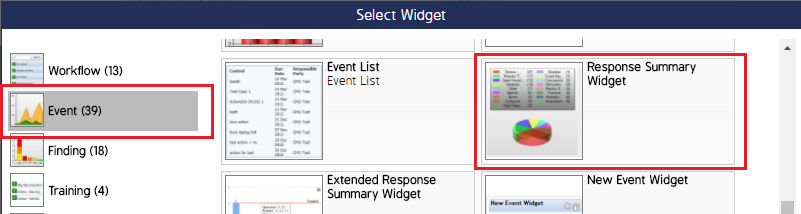
- Select the Dashboard you want to add the widget to, then click +Add Widget. The Select Widget screen will appear.
- Click Event, select Response Summary Widget, then click Ok.
- The widget will appear but will be blank. Click the cog wheel in the top right corner of the widget to add/edit information.
- Configure the respective information about the Form question/response you want to display in the widget.
Note: The Section and Question fields cannot be left as All Sections/Questions for this widget.
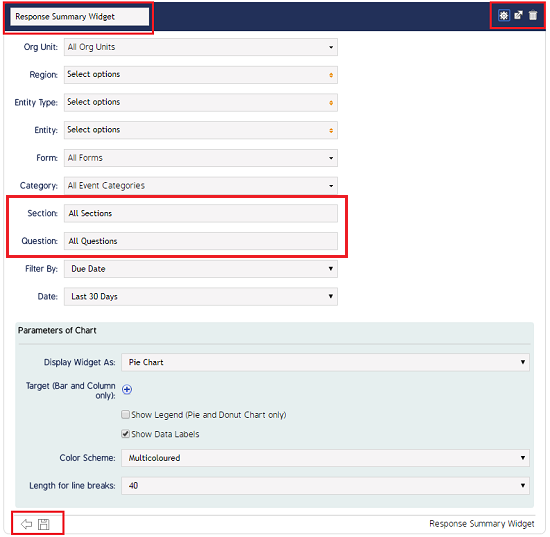
- Click the Save icon in the bottom left corner of the screen.
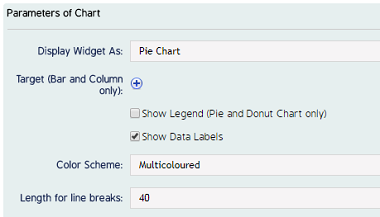
Parameters of the Chart
Use the Parameters of the Chart section to configure how the information will be displayed to users (pie chart, bar chart, color scheme, etc).
Choose a display using the Widget Display As drop-down menu.
For Bar and Column Charts use the +Target option to select a target and color. The targets will display as colored lines in the chart.