Mitratech Success Center

Client Support Center

Need help? Click a product group below to select your application and get access to knowledge articles, webinars, training content, and release notes or to contact our support team.

Authorized users - log in to create a ticket, view tickets status and check your success plan details.


June 2017 - 4.2 TeamConnect Native Reporting

The purpose of this webinar is to teach users how to create new reports, edit out of the box reports, and schedule reports to run on a periodic basis.
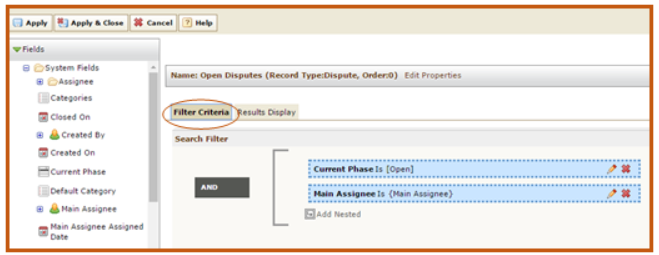
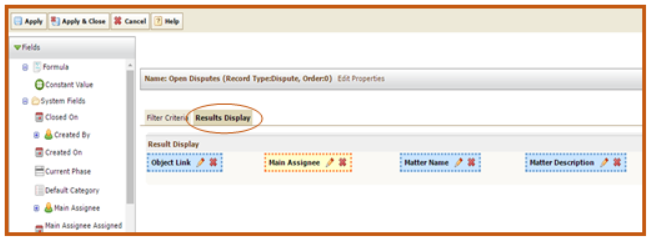
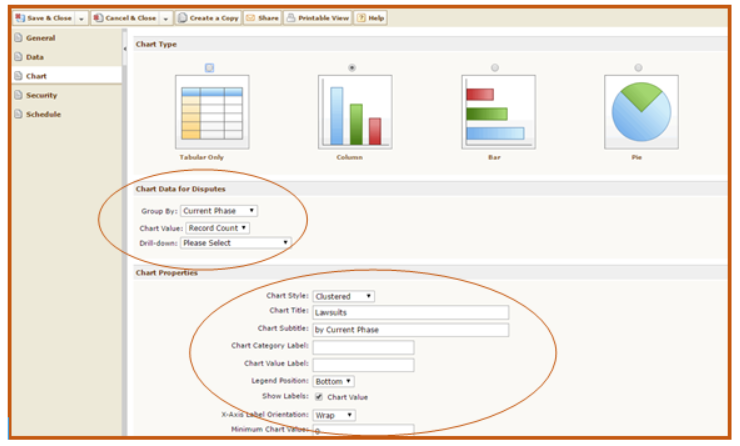
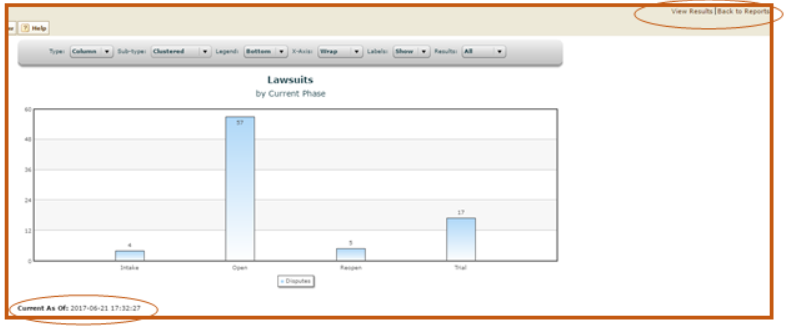
CREATE A NEW REPORT

  • Choose Data Series
    • What fields am I trying to access in my final report?
    • Which object(s) stores those fields?
    • You can have more than one data series
 
  • Select Filter Criteria
    • Which fields should be used to select the data?
    • Do I need to add parameters to the criteria?
TC1.png
  • Select Results Display
    • What information do I want to present in my report?
    • Do I need to edit properties or labels?
TC2.PNG
  • Formatting
    • What type of chart do I want to use?
    • How do I want to group my results?
    • Update Chart Properties
TC3.PNG
  • Run Report
    • Toggle between View Report and Return to Report to see tabular format
    • Current as of shows when the Data Warehouse was last refreshed
tc4.png

 TIPS AND TRICKS

Searching vs Reporting

  • When to use Searching
    • If real-time results are needed
    • If desired results include a one-to-many relationship
    • Single object reporting
  • When to use Reporting
    • If graphical results are needed
    • If you would like for results to be generated automatically
    • If desired results include cross-object data If you need to export the report
    • If the report contains a significant amount of data
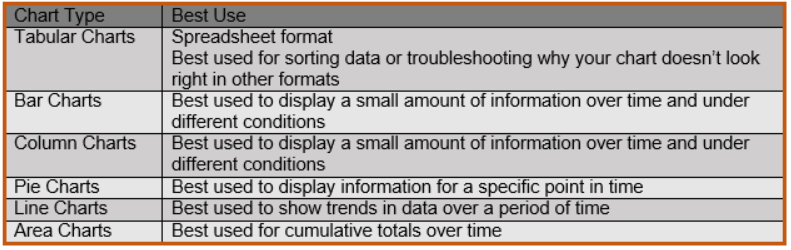
 

Chart Types

tc5.PNG

Report Mapping

Define your report requirements before going into the application:

  • What do you want the final report to look like?
  • Work backwards from the end result on a sheet of paper
  • Include all the fields you want contained in your final report
  • How do you want the data sorted?
  • What type of chart do you want to use?
  • Was this article helpful?