Top 5/Bottom 5 Frequency Report
Top 5/Bottom 5 Frequency Report
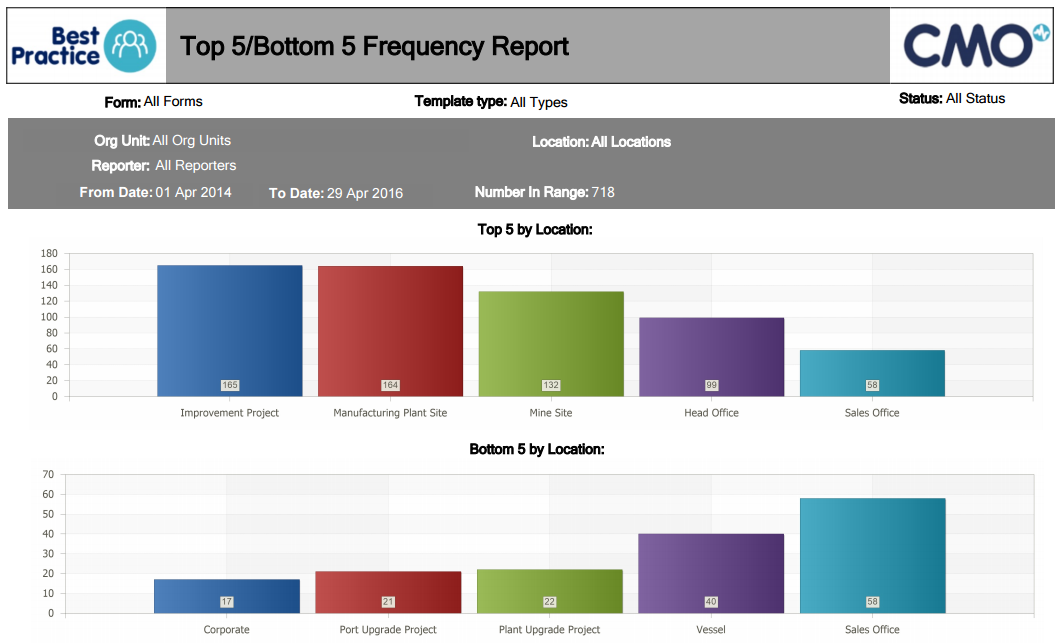
This report allows the user to select an event type or form and then displays a bar chart which shows a count of the number of events that have occurred, grouped by location and event type. The frequency of the event within that location or event type determines whether it will display in the top 5 and/or bottom 5 chart.
Navigation
- Go to the Reports module in the navigation bar
- Select Standard Reports
- Locate the Top 5/Bottom 5 Frequency report from the drop down
Report Layout
The report layout displays in 4 sections from top to bottom:
- Filters used
- Bar graph of Top 5 frequencies by location
- Bar graph of Bottom 5 frequencies by location
Report Filters
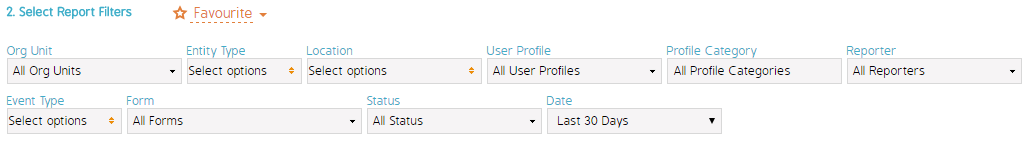
Report Filters